

A common metric analysis workflow involves controlling for mix changes - e.g., did changes in the mix of segments affect the metric or did certain segments improve their behavior?
This pattern occurs frequently - in growth metrics like conversion or retention rates or in price-volume analysis in logistics, or in margin % calculations in finance and so on.
Let's consider an example of a retention metric that has improved over two time windows, from approximately 37% to 43% by around 600 basis points. Let's also assume we have three acquisition channels with varied retention rates and levels of improvement.
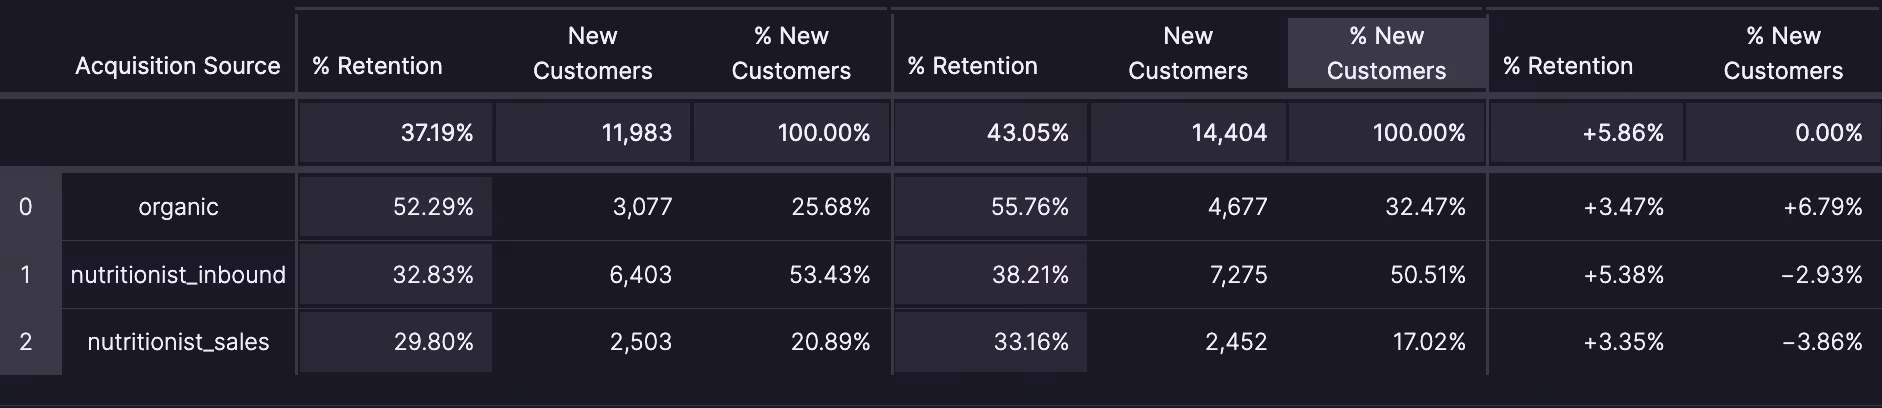
At first glance, all three channels have improved their retention rates between 300-500 basis points. Additionally, the organic channel has significantly increased its mix, growing from 25% to 32% of the customer base. Note that this channel has higher than average retention rates.
At this point, a growth lead might export this data into a spreadsheet to more precisely evaluate the impact of the organic channel volume spurt, or a product manager might want to calculate the impact of a new retention initiative.
But what if software could automatically execute the necessary calculations and attribute the impact?
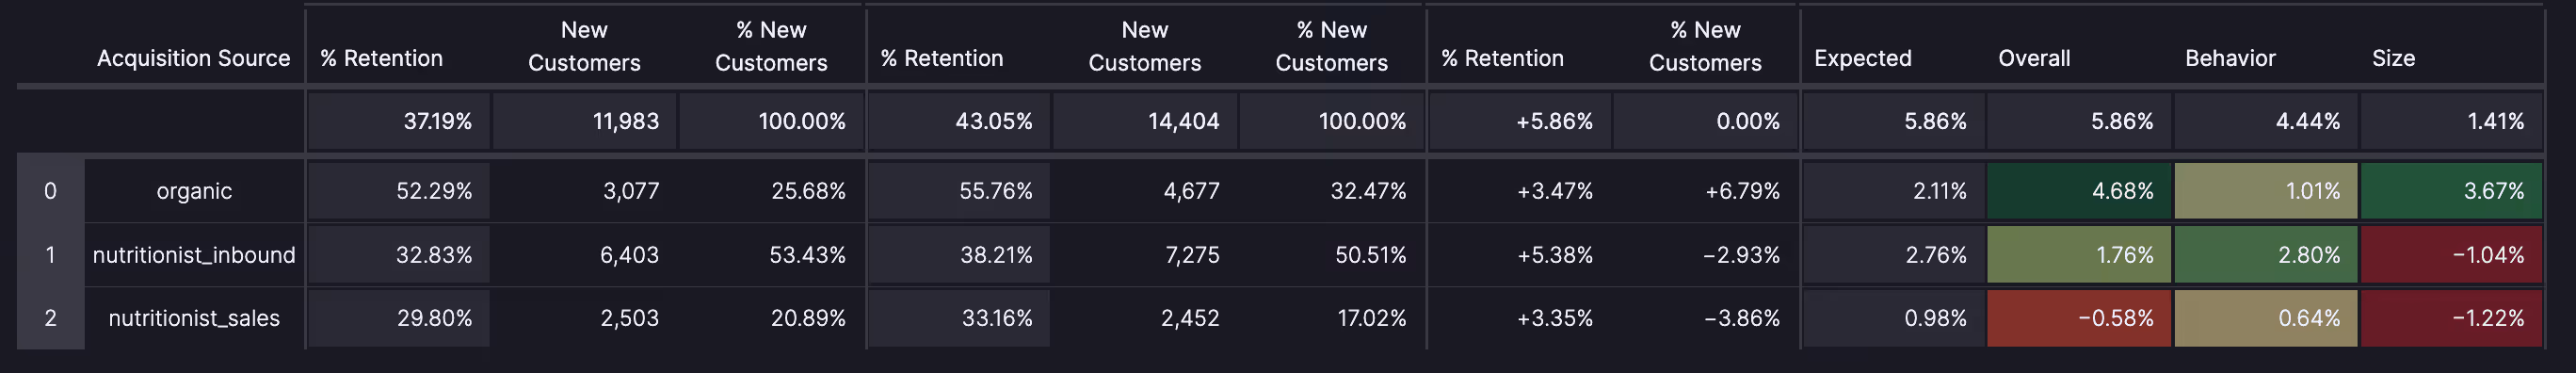
The new cells on the right provide the calculations to tell this story. "Size" captures the impact of the segment sizes changing, while "Behavior" captures the segment behavior changes.
This shows that:
Sometimes, volume changes inversely affects behavior. Growing a specific channel can lead to less qualified, lower converting users. In these instances, this math becomes more compelling especially if we could also compute the residual, incremental growth effects, if any.
There are many such opportunities for software to help us with the heavy or tedious lifting.