Organizing your metric trees and associated segments is a key part of an organization's data strategy. However, if you consistently drive workflows from it, you can now shape business strategy, and operate your functions with precision and rigor.
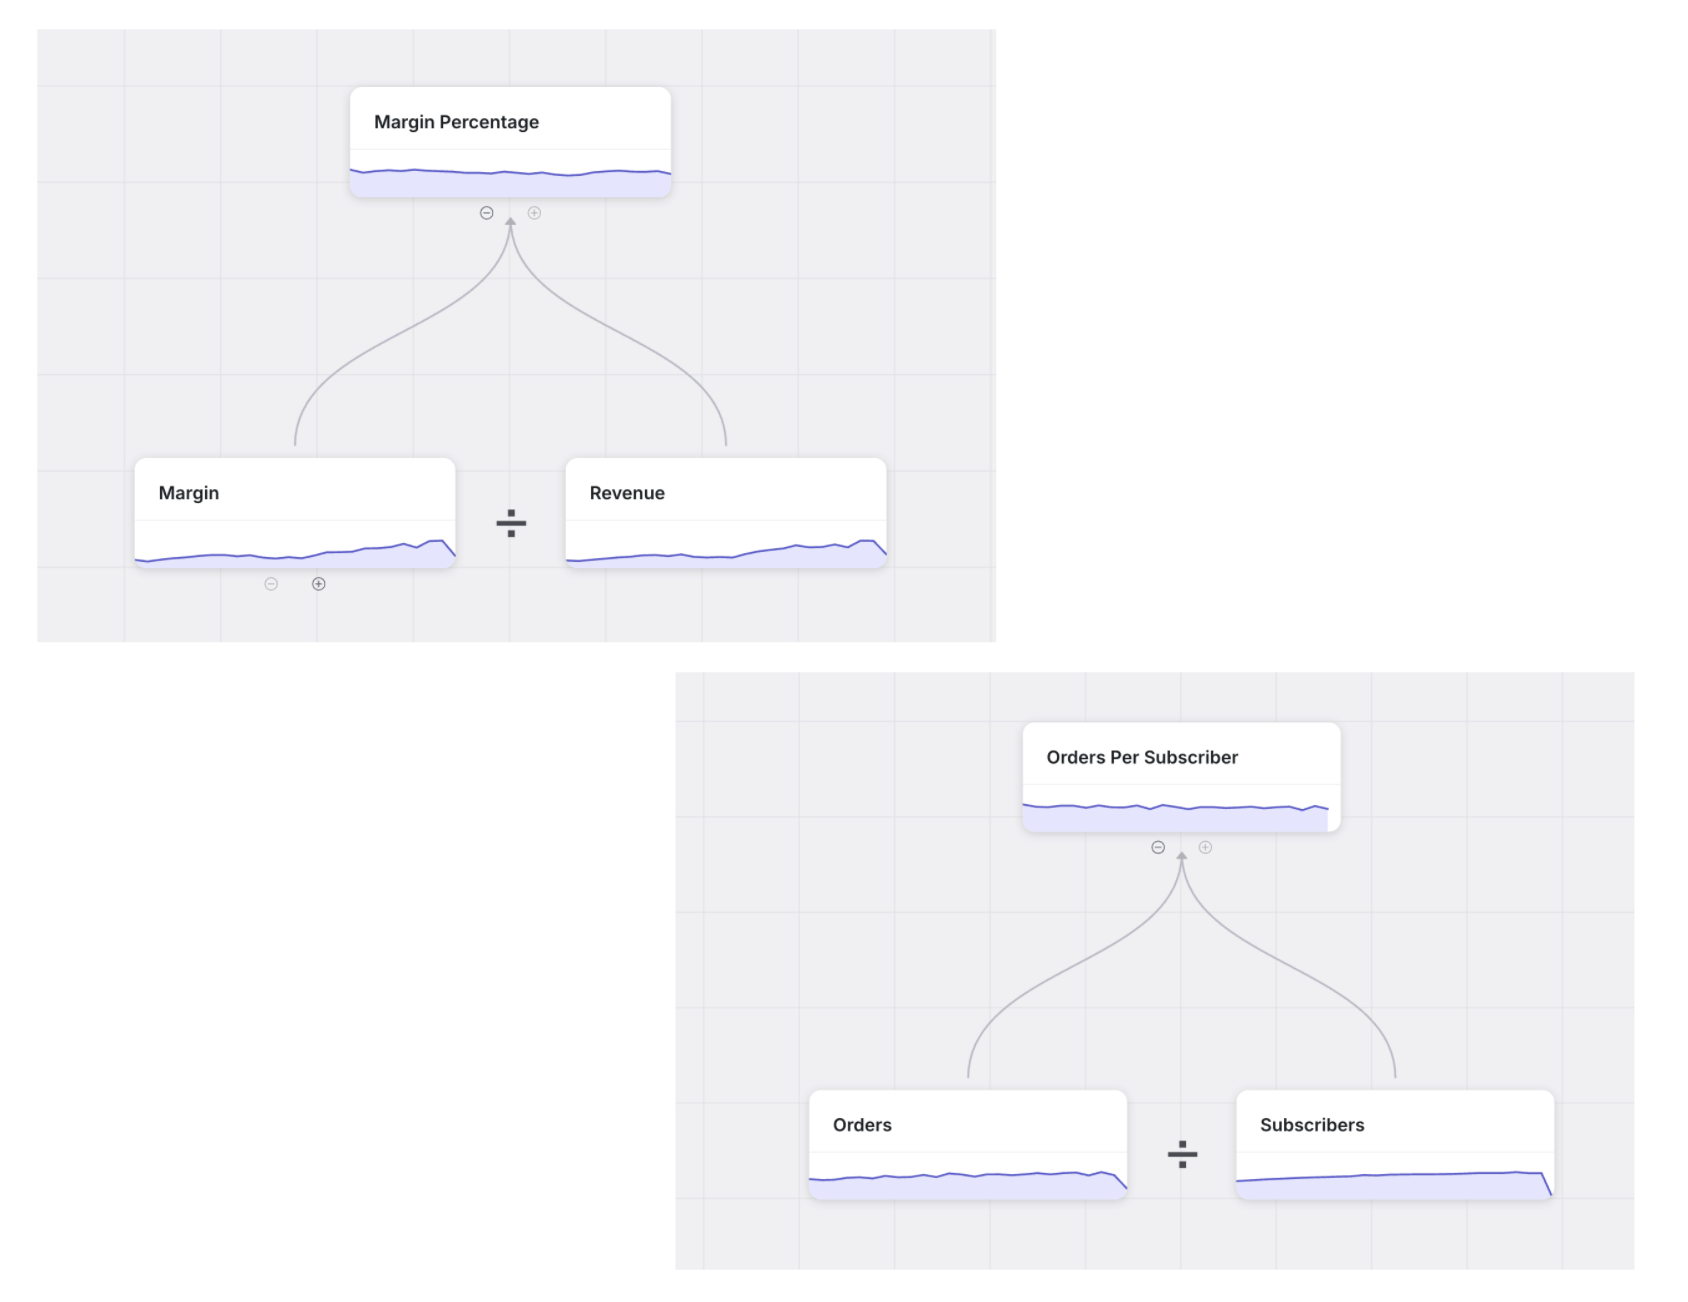
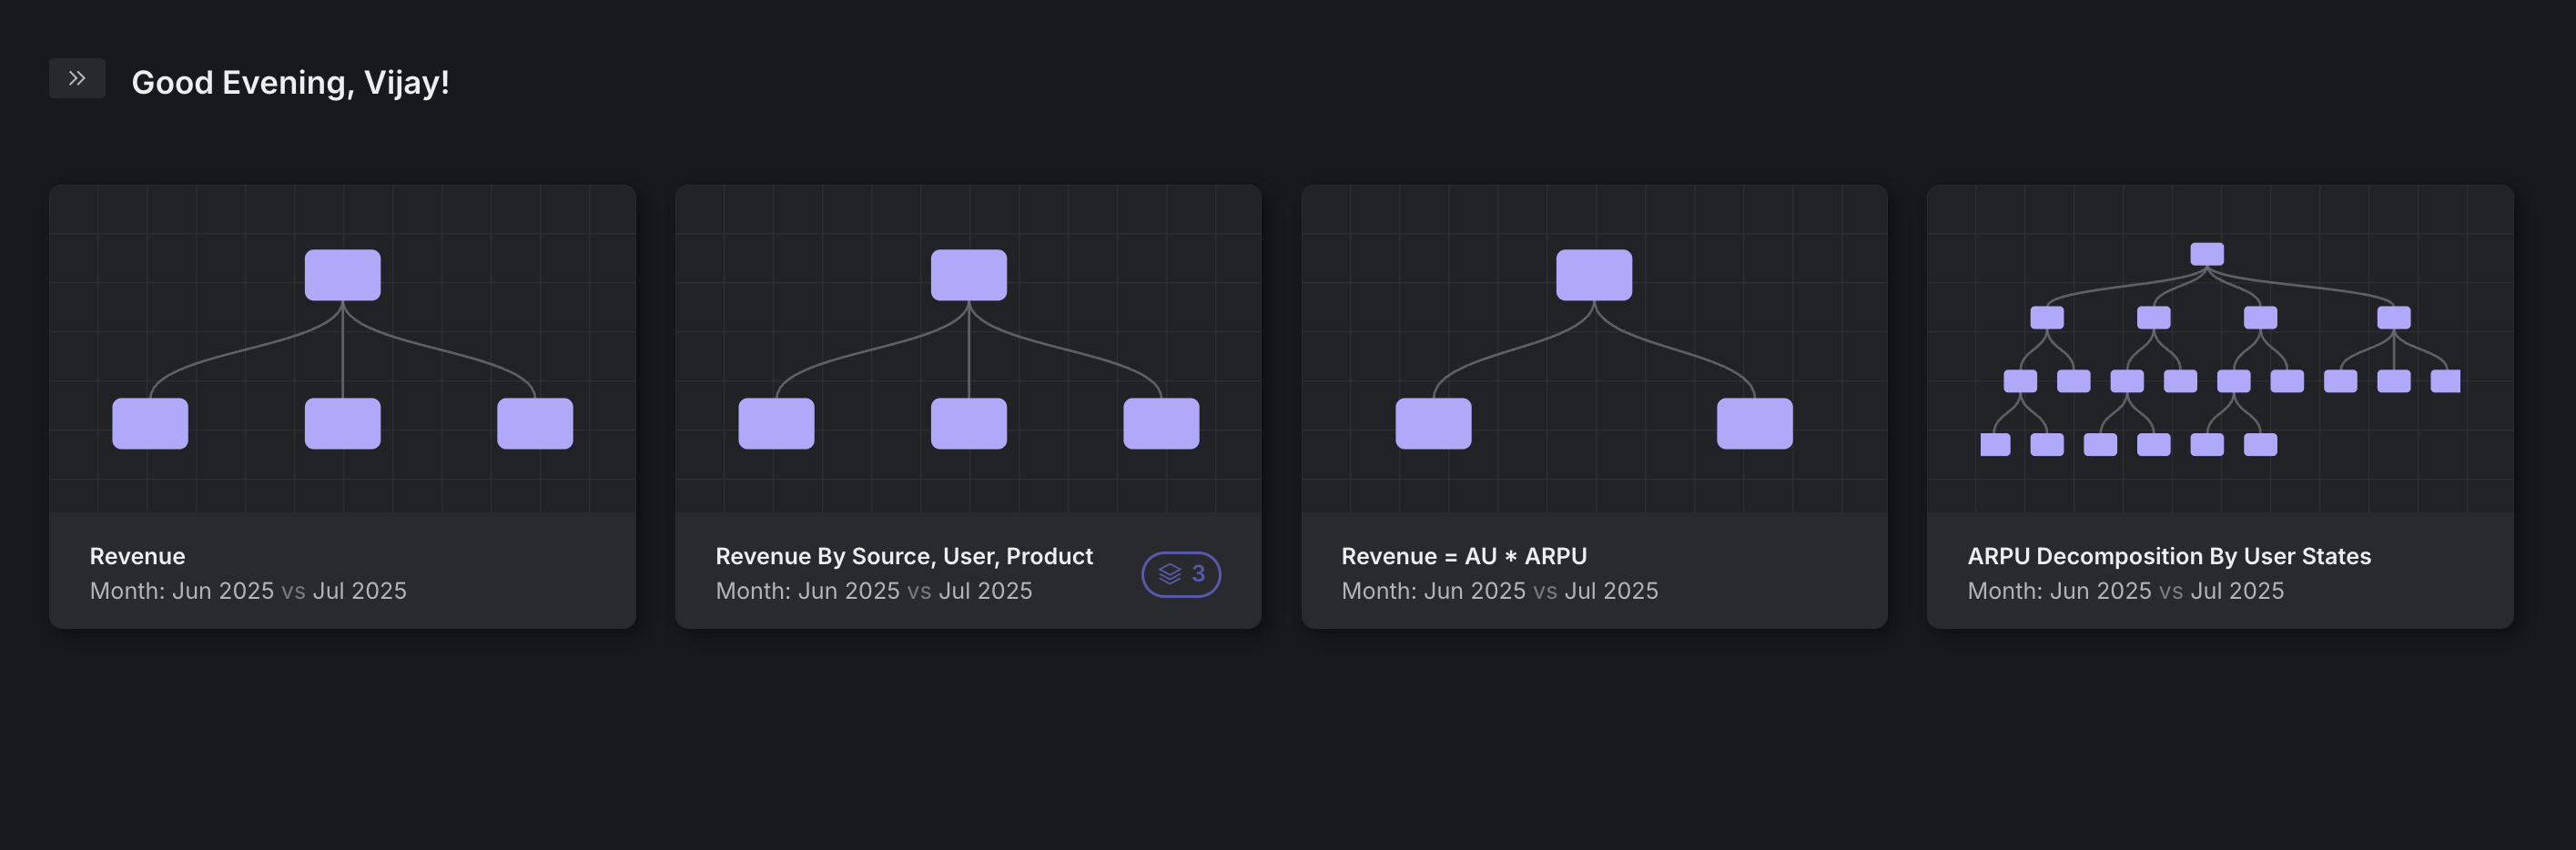
Let’s run through an example: let’s take the metric tree for a transaction-driven business model, and for simplicity, let’s assume we are modeling an eCommerce brand.
As we track the key north star metric of revenue, we observe an unexpected decline as shown by the red triangle. We have two metric trees that ladder up to revenue. We now walk down these trees to analyze which component metrics are the drivers.
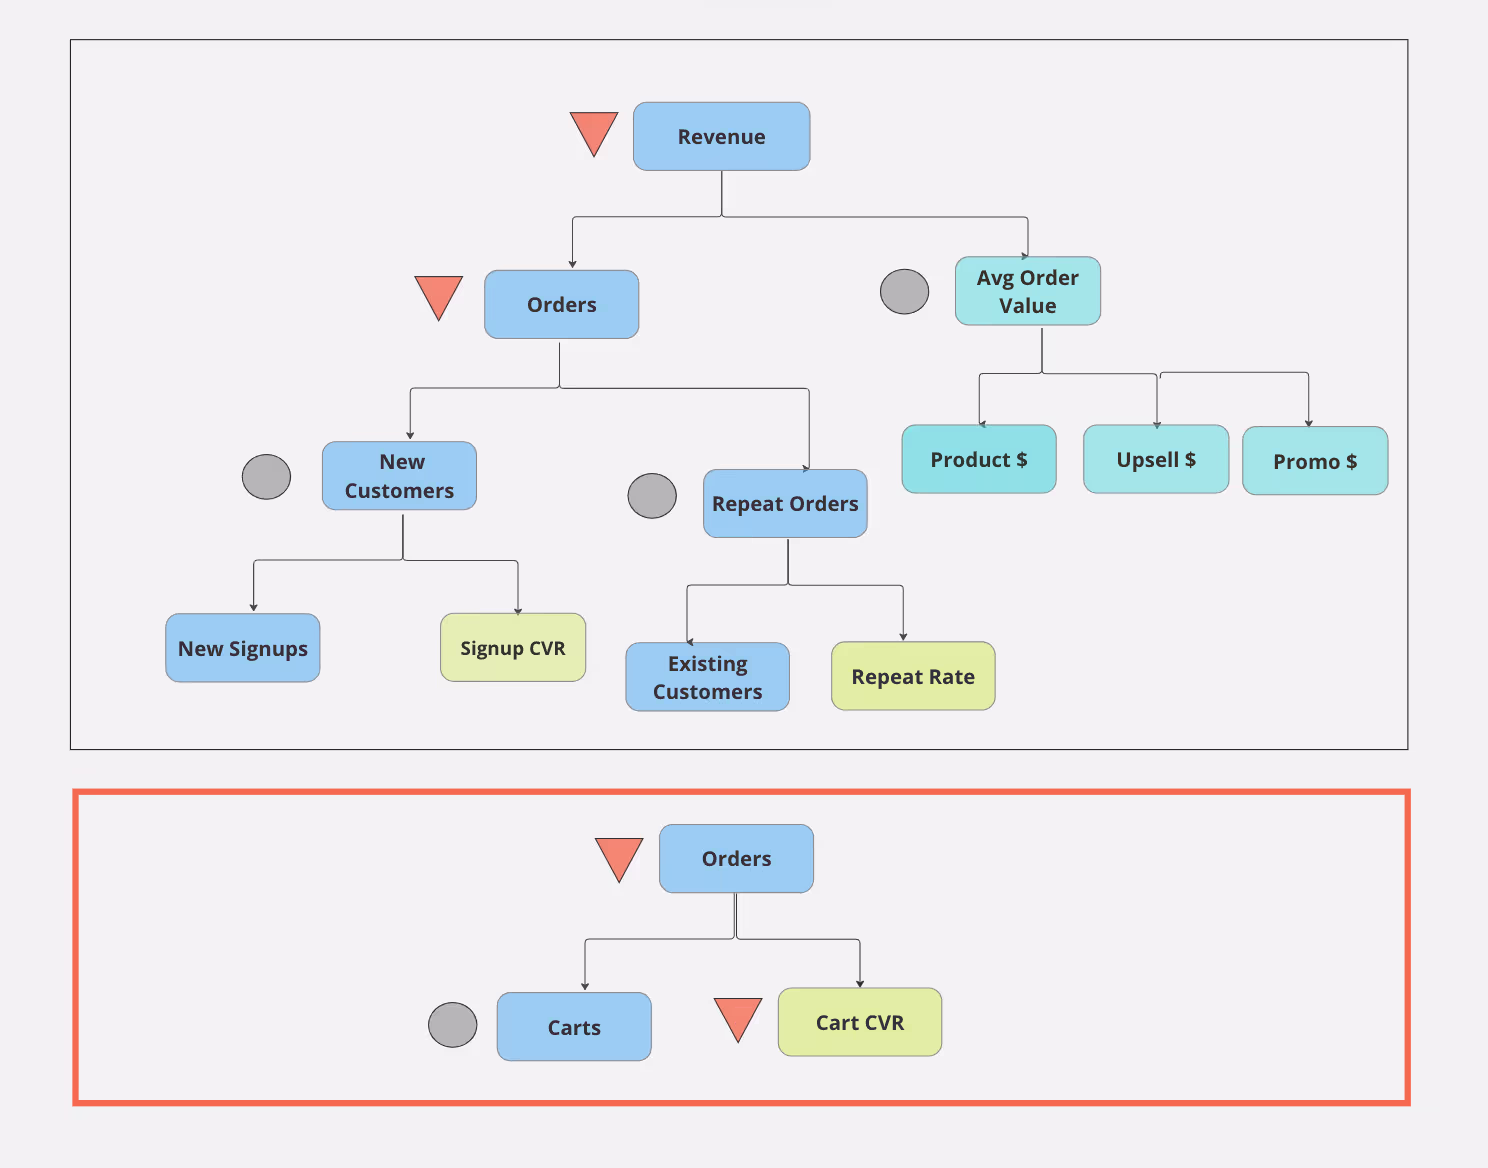
In the main tree, we observe that the decline is proportional to new vs repeat customers, which does not seem to explain the “why”. So, we label this with grey circles. However, the cart tree points to cart conversion rate as a potential culprit, not the actual number of carts created.
It is now likely that whatever underlying phenomenon is affecting cart conversion is affecting new and repeat customers proportionally.
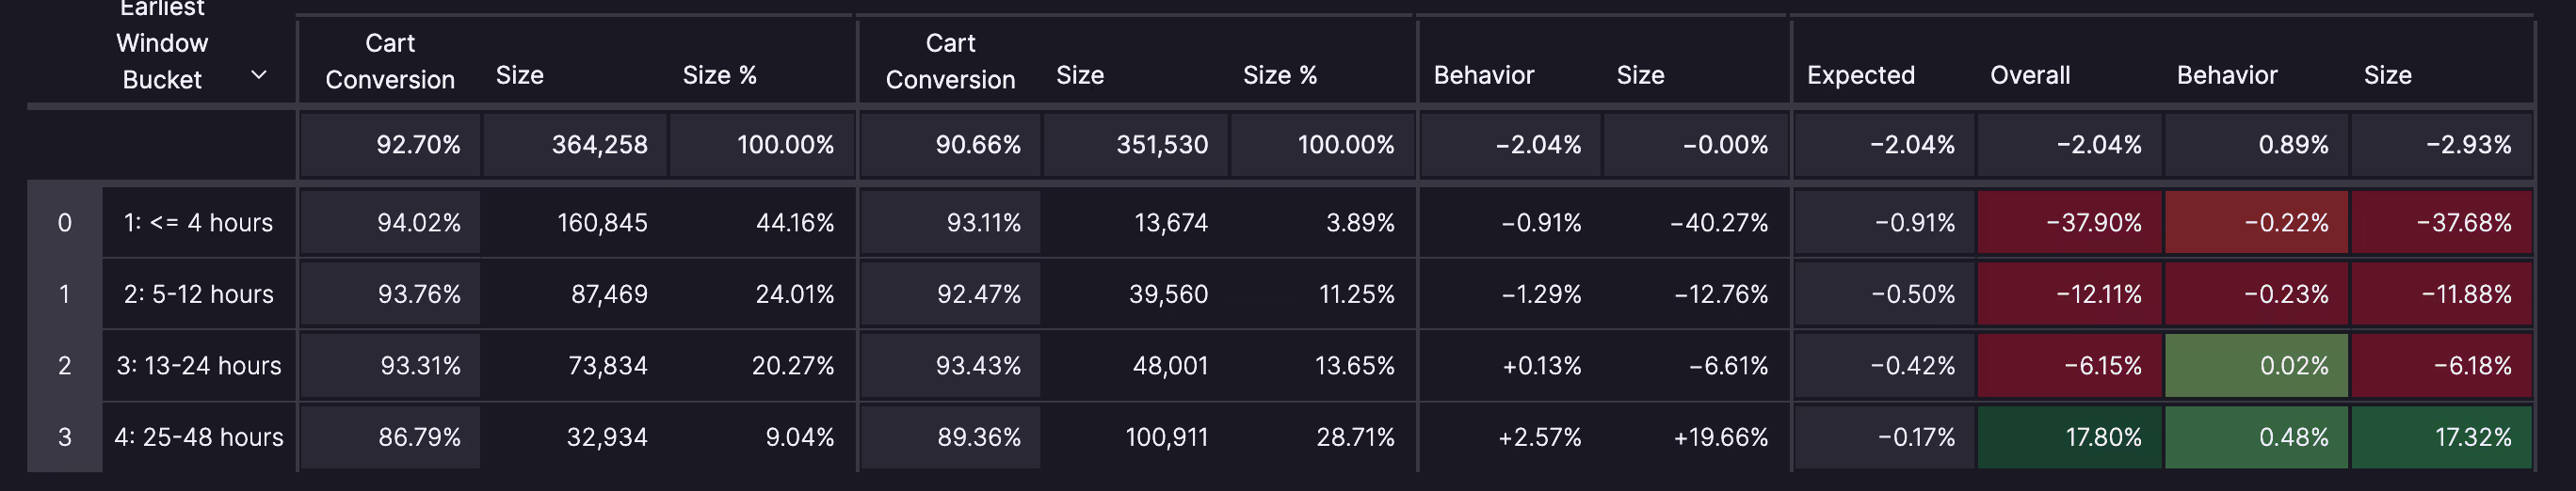
The next step involves disaggregating the drop in cart conversion across the several possible segments to explore a root cause.
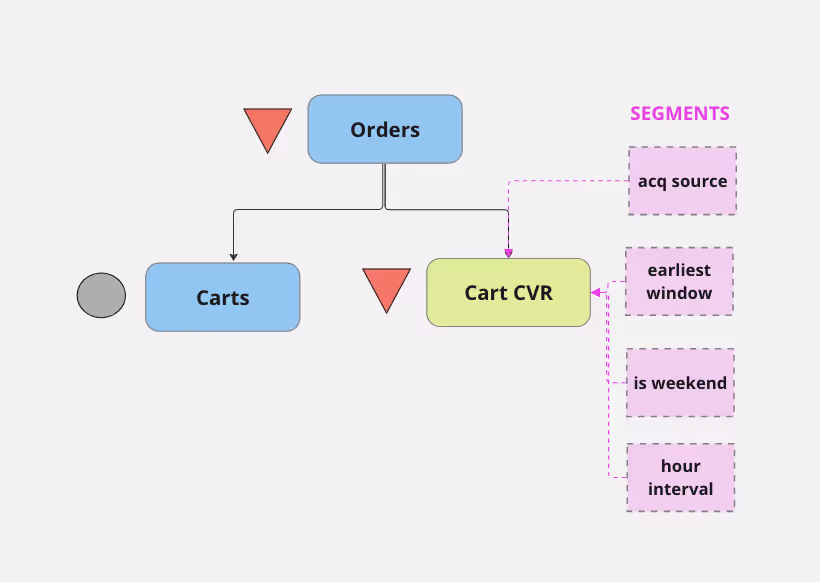
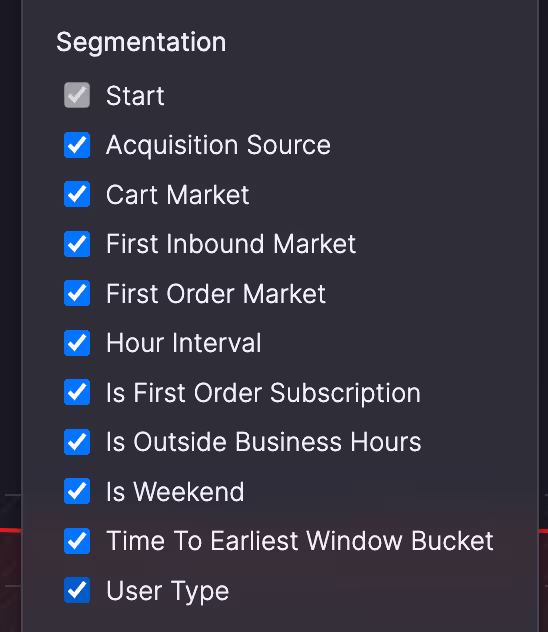
When we do this, we find that the promised window of delivery has shifted significantly later causing the decline in conversion. And, this manifests as a decline in the north star revenue metric.
It is now possible for a piece of software to do all this heavy lift:
- to traverse the trees
- to identify the “issue” metrics of interest
- to further disaggregate into segments
- and allow you to take timely action
This saves an analyst multiple days of painstaking ad-hoc work, and more importantly, this process can keep running in the background, or invoked with low friction. We are entering an exciting era in analytics automation and distribution.