
I have written about the lessons from the first wave of cloud data platforms, and how the next wave of tooling needs to usher in a layer of standardization and abstraction that can power rich transformation functionality in the hands of end users, the analysts and operators. I see a future in which a powerful ecosystem of applications built over this abstraction solves many common and complex use cases.
But, what is this abstraction layer really? I’ve used the term “business semantics” to denote this; semantics is the study of meaning in the context of language - natural and computational. So, it is worthwhile to note that we are talking about business semantics - not about how the data is captured and represented, tables, columns, data types but about the key business entities, the metrics, the attributes, the segments, the experiments, the processes etc.
This business semantics layer has three massive implications:
1. it can transform (no pun intended) the data team’s perspective - away from the daily reactive grind of writing code and generating datasets into a holistic view of their system, and how to improve its design to accurately represent the business
2. this holistic view enables a richer dialogue between data and business teams as it provides a common interface to align on what exists, what is possible, what is important etc.
3. the most important implication of all - this layer, if implemented well, can be understood by machines, and software can automate a whole set of operations that today requires bespoke (and often unenjoyable) work
What is the most intuitive way to represent such a layer? It turns out a networked graph is a natural representation of how any organization operates - so this semantic layer can be best visualized as a business semantic graph. Let’s look at an example, a marketplace business with suppliers and buyers; let’s assume individual suppliers belong to a parent entity covering a while region - geo_suppliers. Let measures represent calculations on the entity, metrics represent aggregations, and attributes represent well, attributes of the entities.
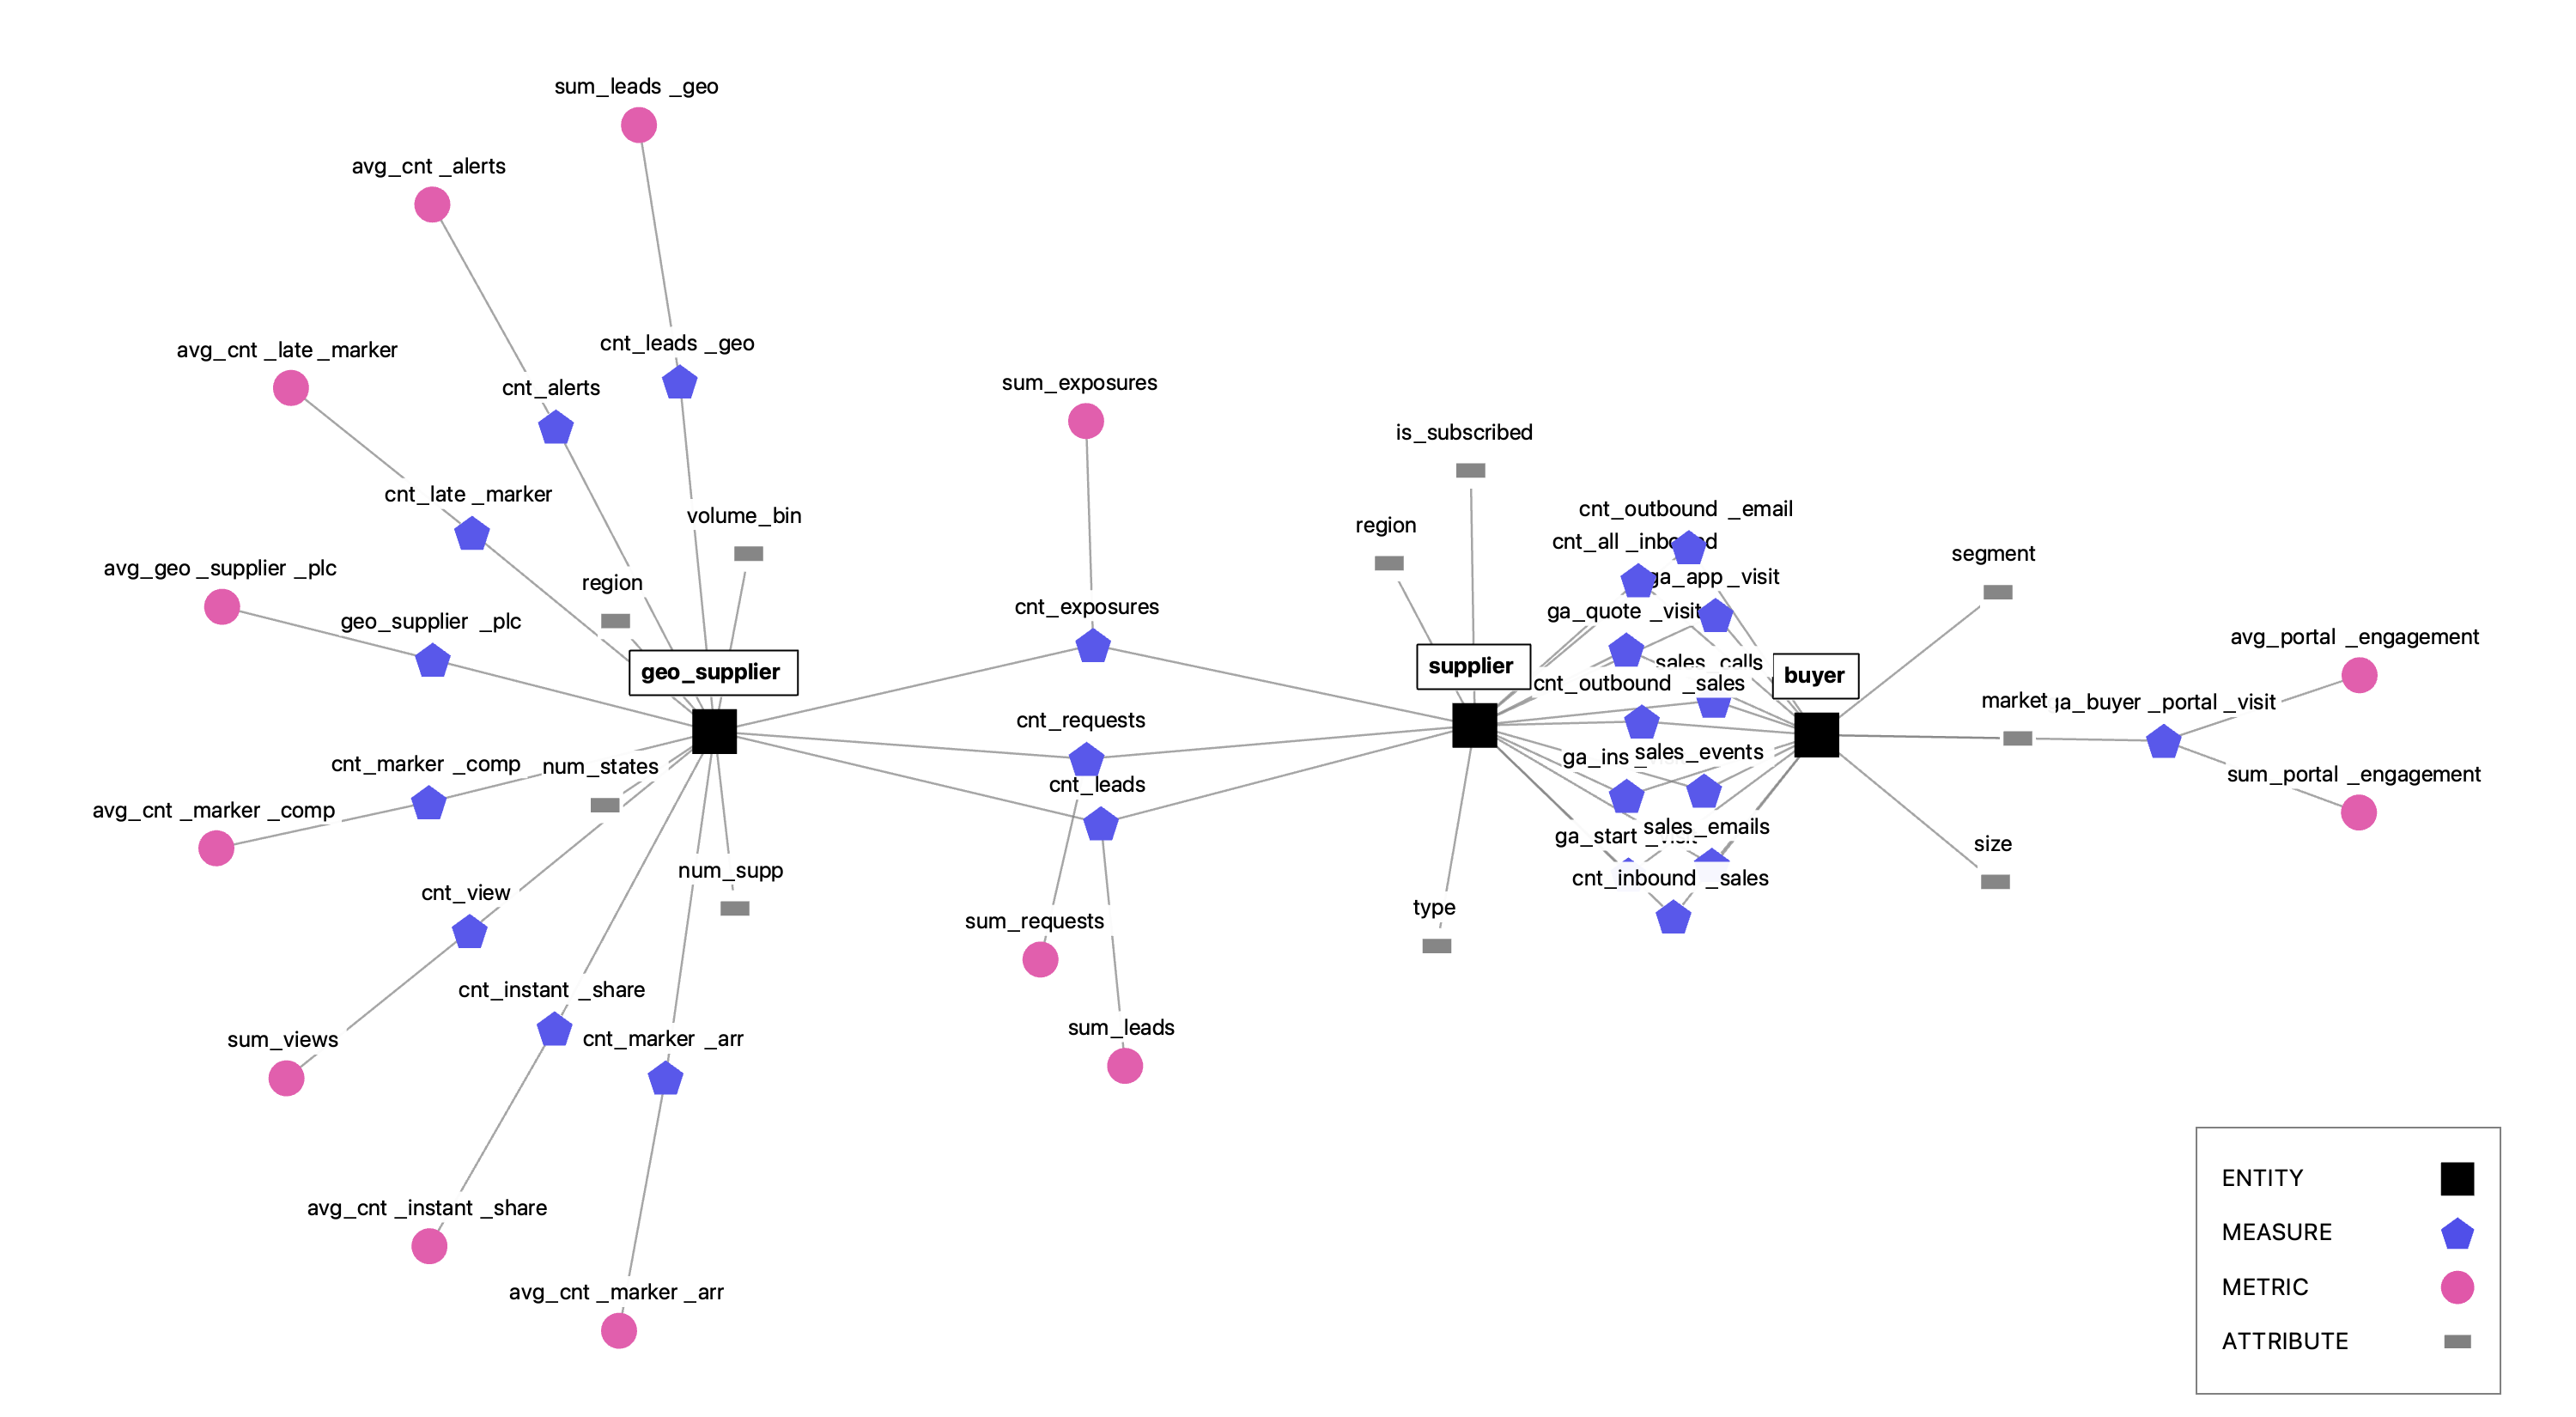
Some observations and implications:
a. The first thing to notice is that entities (like suppliers and buyers) are the fulcrum in this graph. Without real business entities, business semantics is incomplete.
b. A “metrics catalog” is now available out of the box, and you can see which entities are present in each of these definitions, and as a direct consequence, which attributes are available for analysis.
c. The graph not only shows the objects in the system, but actually signals what is computationally possible - making it a clarifying interface between the data and business teams, helping with the perpetual frustrating interaction of “can we look at X or Y by Z?”. For example, there is a whole set of measures that are intimately connected to the marketplace mechanism, and are described by both the the buyer and supplier. These can utilize attributes defined on both entities say in a “cube” calculation.
d. However, the portal engagement metrics are only defined on the buyer - this is either correctly defined or could highlight a gap between the available model and the business reality in that it exposes a missing connection; imagine if a user could then establish an entity link in this UI, which instantly makes the linked entity’s attributes available for analysis!
e. The portal engagement metrics calculate an average or a sum over buyers - a business user could add new types of calculations on top of measures in a graph like this, ideally guided by a collaborative review process
f. Extrapolating - can you imagine your entire business being able to view such a graph and engage in an ongoing conversation around measurement, attributes and segments, drivers, causality etc.? That would elevate the quality of analysis, and the ROI from your data assets.
g. Digging one level lower, this graph could capture valuable org-wide collaborative information:
- tiers and tags of importance: inputs, outputs, primary, secondary, strategic, operational, leading, lagging, causal, correlated
- ownership: which teams are responsible for metrics clarifying alignment and exposing potential conflicts
- relationships: metrics X and Y follow each other in entity E-1’s lifecycle OR metrics C and D are either-or terminal states for entity E-3
Finally, to bring this all back to the biggest unlock - applications-on-semantics, all the ideas surfaced above can be realized only to the extent a piece of software can understand this graph, and power valuable use cases and applications. I recall a podcast where Bob Muglia (most recently CEO of Snowflake) remarked that while SQL is powerful and will be around for a while, the future will involve us operating on a knowledge graph at a higher level of abstraction. The business semantics graph is a step in that direction. Excited for this future!


