Financial metrics were the first important metrics, and the P&L (Profit & Loss statement) was the original metric tree!
A P&L provides a timeless example of how metrics and their relationships can be structured to reflect the underlying dynamics of a business. The P&L has three key properties that make it a classic metric tree:
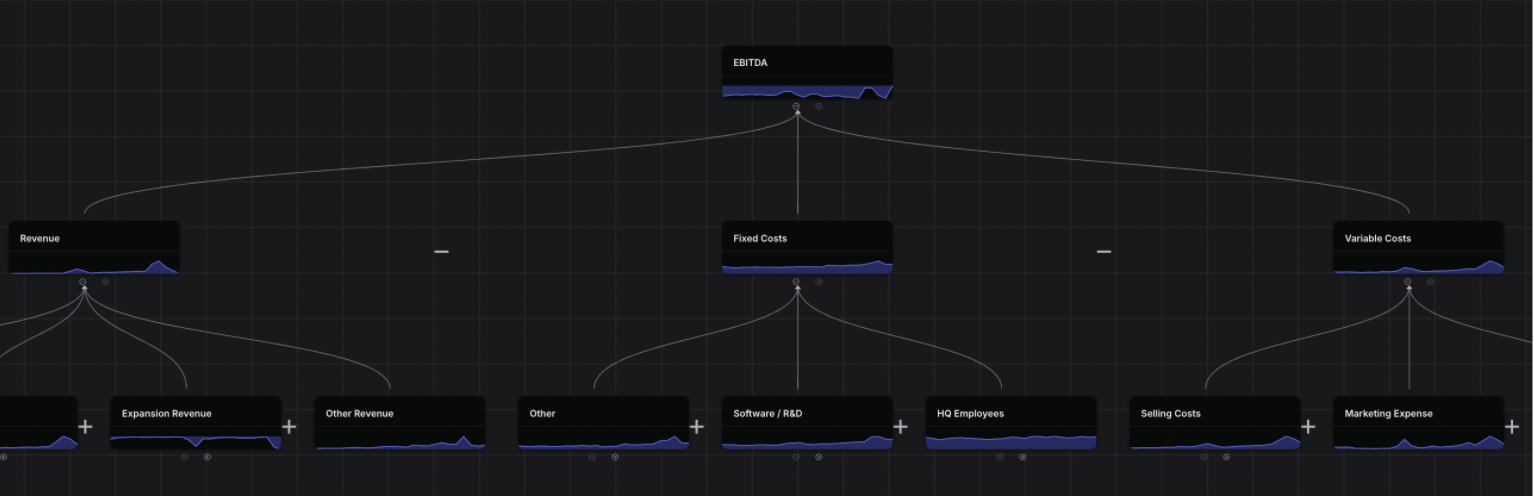
1. Natural Decomposability of Metrics:A P&L comprises output metrics that can be naturally broken down layer by layer.
For example, EBITDA can be decomposed into revenue and total costs or expenses. Costs can be further decomposed into its components - fixed vs variable, and each of these can in turn be decomposed into their components.
This cascading breakdown of metrics is now the most common pattern in how businesses analyze their performance.
2. Segment Slices and Component Inputs:Some metrics in the P&L, or nodes within this tree, contain both segment slices and component input metrics.
For instance, operating expenses are broken down into categories like marketing, sales, and general & administrative (G&A). Within marketing expenses, you can segment further by various channels.
This duality of segment-based decomposition and component breakdown is a recurring property in metric trees.
3. Operational Cadence, Insights and Action:What truly makes a P&L valuable is not just its creation but the operational rhythm around it.
Tracking, analyzing, discussing, and taking action on P&L metrics—whether the actions are tactical or strategic—creates a feedback loop that drives business performance.
In essence, the P&L was the first metric tree, representing a foundational way of understanding business performance. This model set the stage for how we can structure and use metrics to inform decisions in every function at every level of an organization .


