The metric trees framework will revolutionize the BI/analytics workflow, especially in how data is consumed.
Traditionally, consumers perform manual, tedious, repetitive operations on pre-built dashboards or data exported to spreadsheets to understand the ground truth in business performance. But with metric trees as the next-generation data model, we are looking at the potential for 80%+ automation—radically transforming how this work is done.
The current consumption layer in BI workflows is heavily manual because the inputs are pre-built datasets presented in static dashboards. Users must slice, dice, and manipulate the data to analyze the why behind the facts presented.
Once the analysis is complete, more time is spent on formatting and sharing the key insights. This manual process limits what’s achievable in today’s organizations, creating bottlenecks in decision-making or leading to decisions being made blind or partially blind.
This is where metric trees come in. Instead of static dashboards, metric trees organize business metrics in a hierarchical, intuitive structure, mapping out key metrics and their relationships. Think of it as a dynamic, interactive “graph of dashboards”.
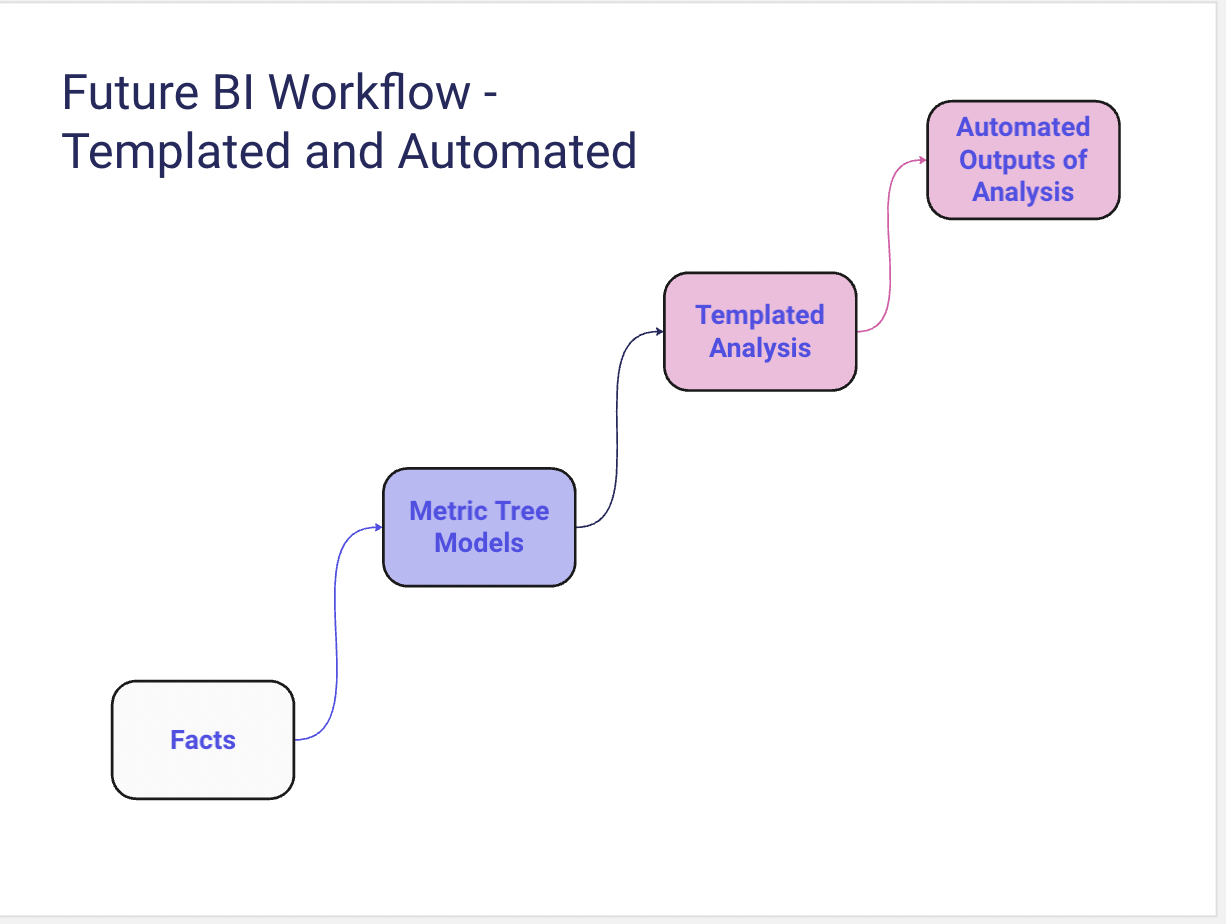
The productivity unlock happens when software natively understands this data model and can execute templated analysis—identifying trends, drivers, and root causes. Coupled with automated dissemination, decision-makers can receive rich, thoughtful and actionable reports directly tied to the metrics that matter most.
Metric trees enable 80%+ automation in BI workflows, unlocking faster insights and empowering teams to drive data-backed decisions with unprecedented efficiency.


