If your business review materials are simply a 1:1 collation of dashboards, be prepared to expend considerable organizational time to produce them, while most consumers will likely glaze over.
The main issue is that a collation of dashboards typically focuses on output metrics—scanning key output metrics and their trends doesn’t give visibility into the underlying drivers.
Even if this collation includes input metrics, without a clear model showing how variations in these input metrics and the various dimensional slices affect the output metrics, the process devolves into the organization spending enormous time munging data inside BI tools or spreadsheets—or, even worse, simply moving on due to time constraints.
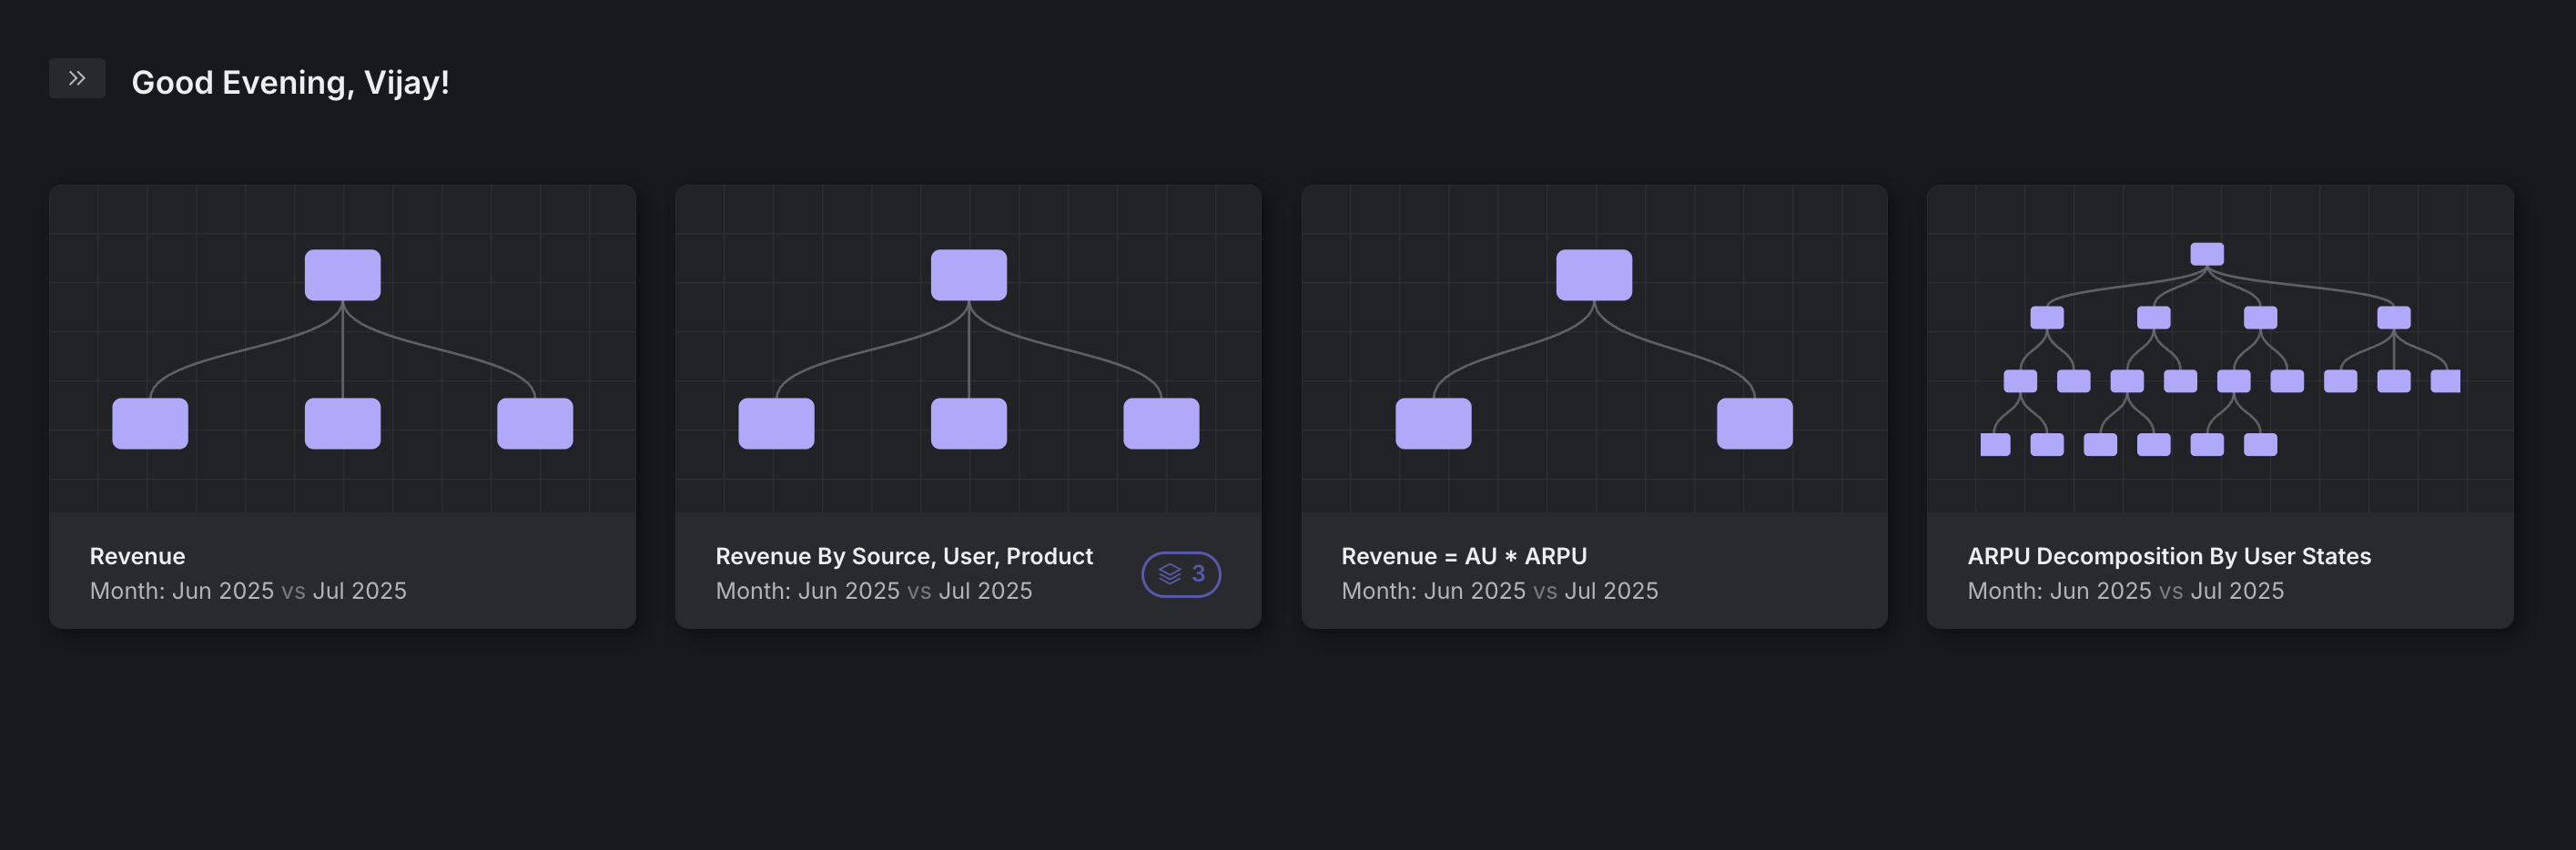
This is exactly where a framework like metric trees comes in. Metric trees explicitly encode metric dependencies, making it clear how input variations could impact the outputs.
But this in of itself is insufficient - this framework needs to be powered by algorithms that can analyze these dependencies, transforming hours or days of manual work into minutes.
However, this is easier said than done. It’s the equivalent of seamlessly and instantly blending metrics and insights from several dashboards into one cohesive, actionable view.
This is what we’ve built and will continue to iterate on as we bring metric trees to life within organizations!


