
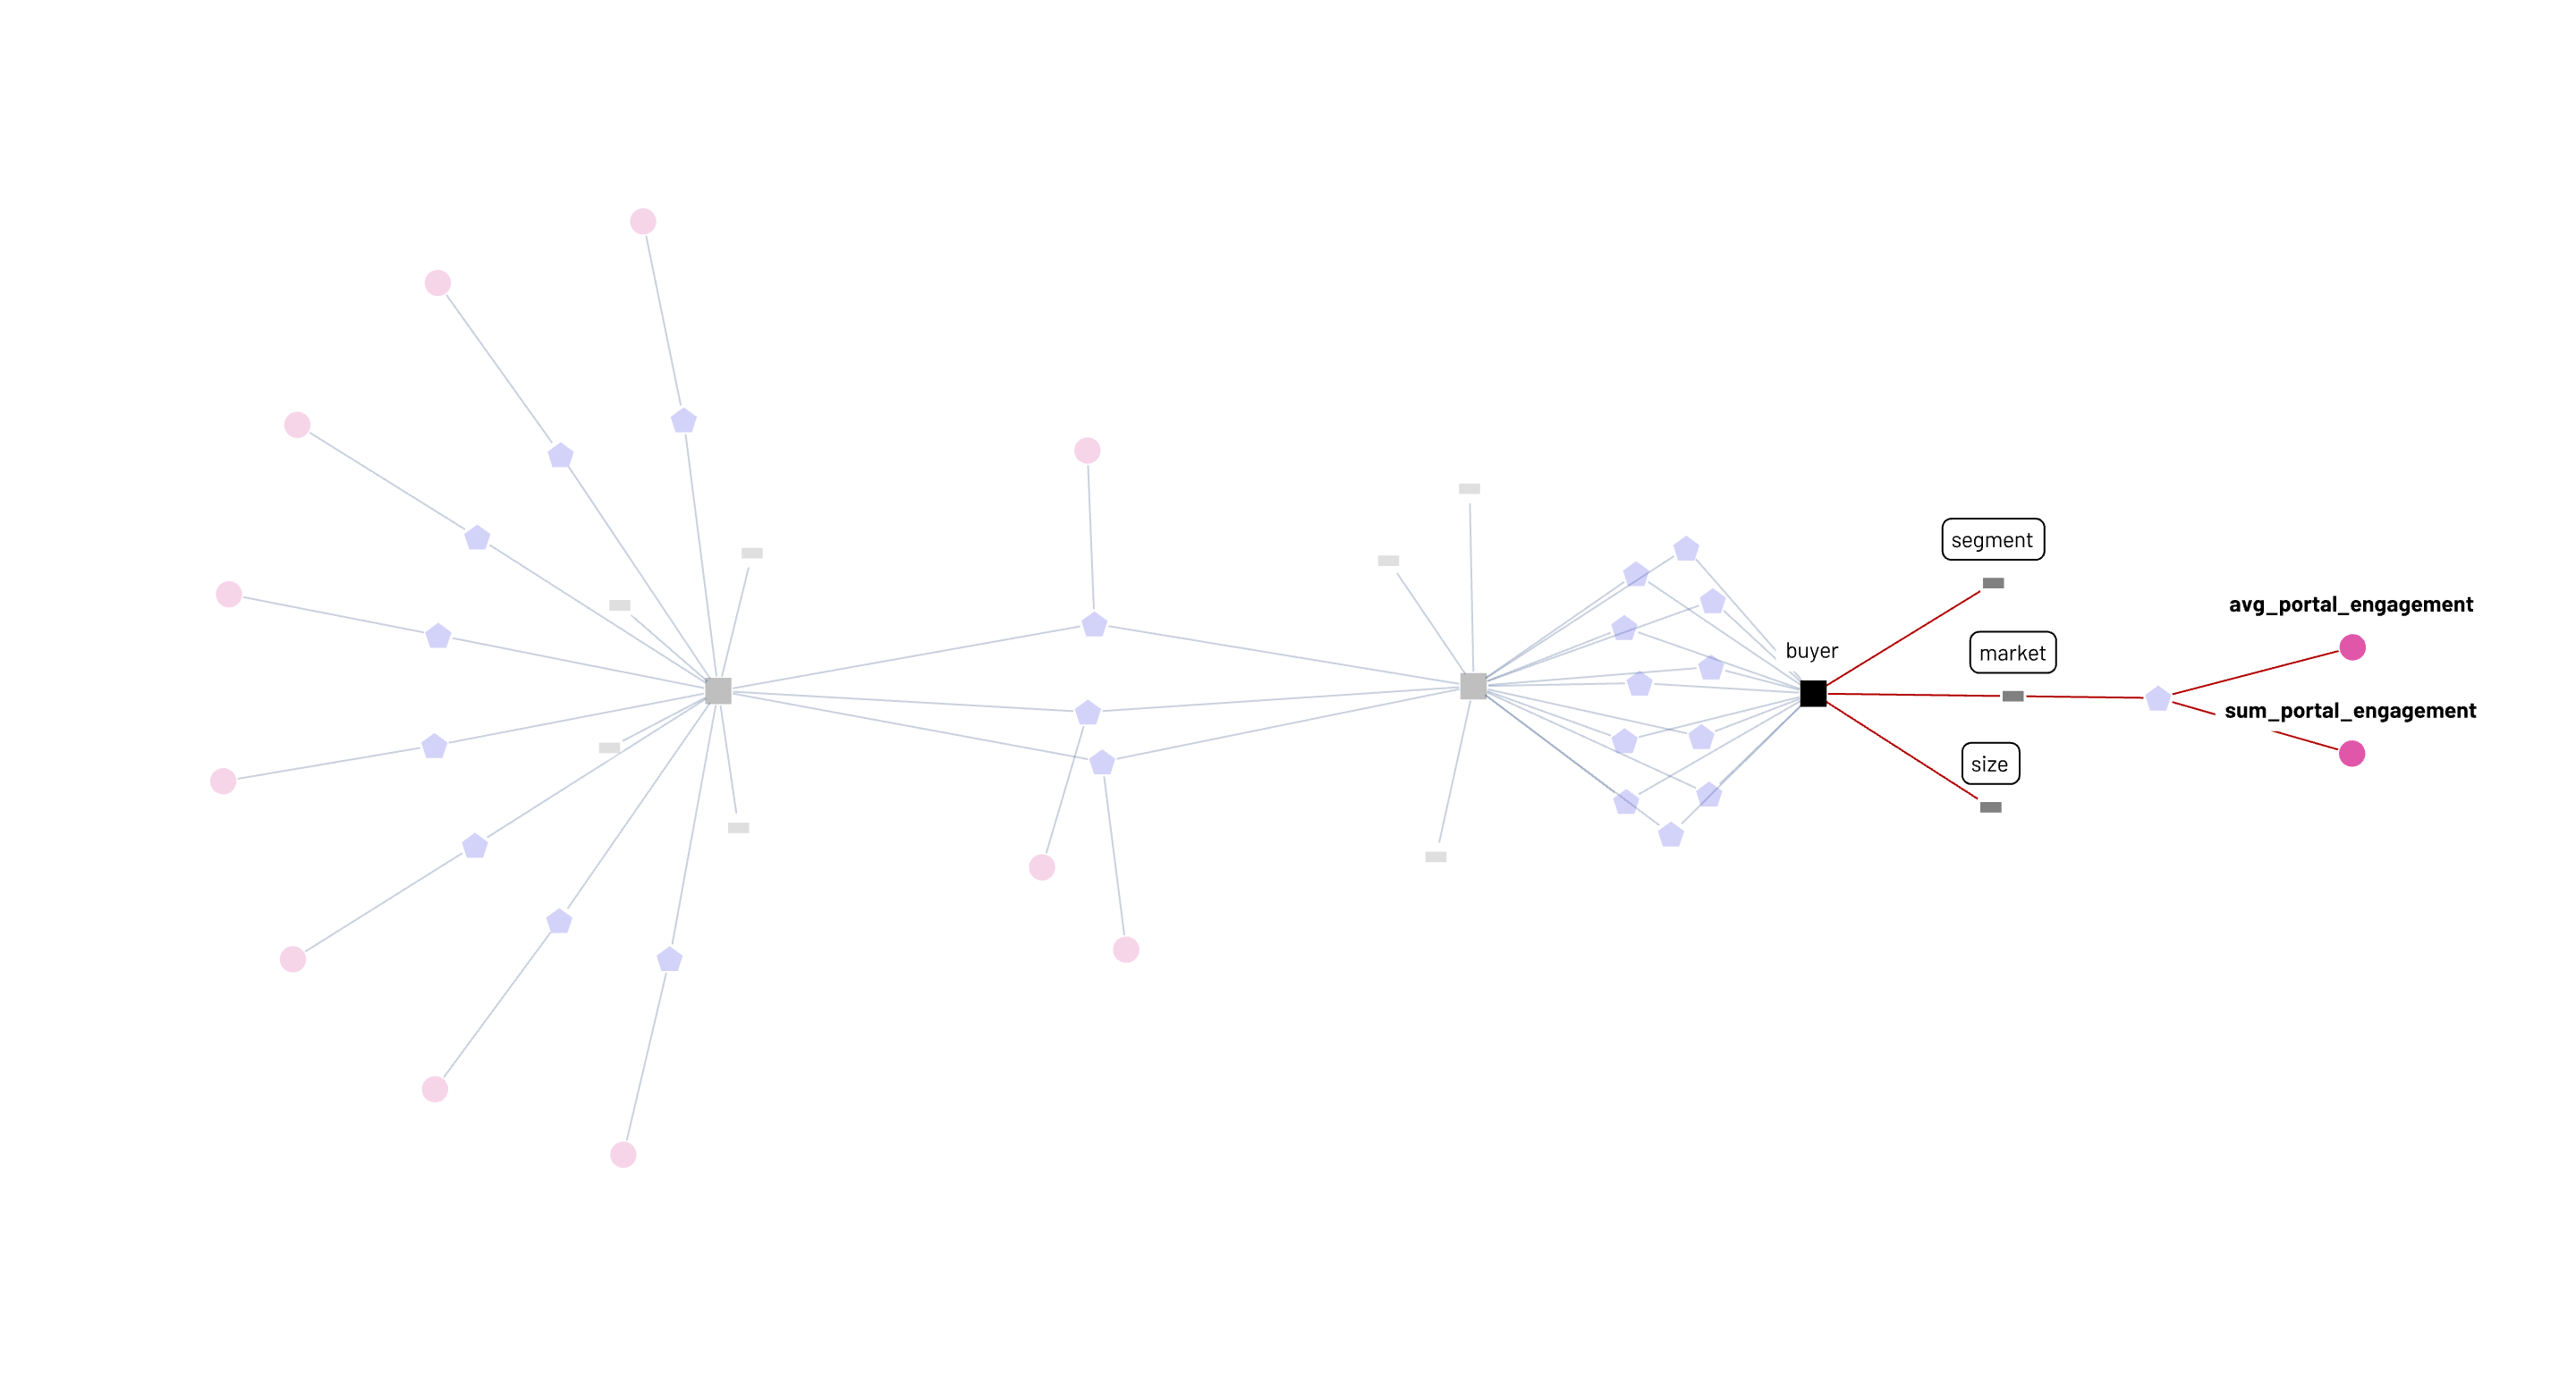
I have articulated the need for business semantics, and described a future where a powerful ecosystem of applications built over this abstraction supercharges metrics-related use cases. In a prior post, we looked at an example visualization of this semantic layer, a business semantic graph of a hypothetical marketplace business with suppliers and buyers where suppliers belong to a parent entity called geo_suppliers. In this post I want to dive deeper into some specific use cases of the graph.
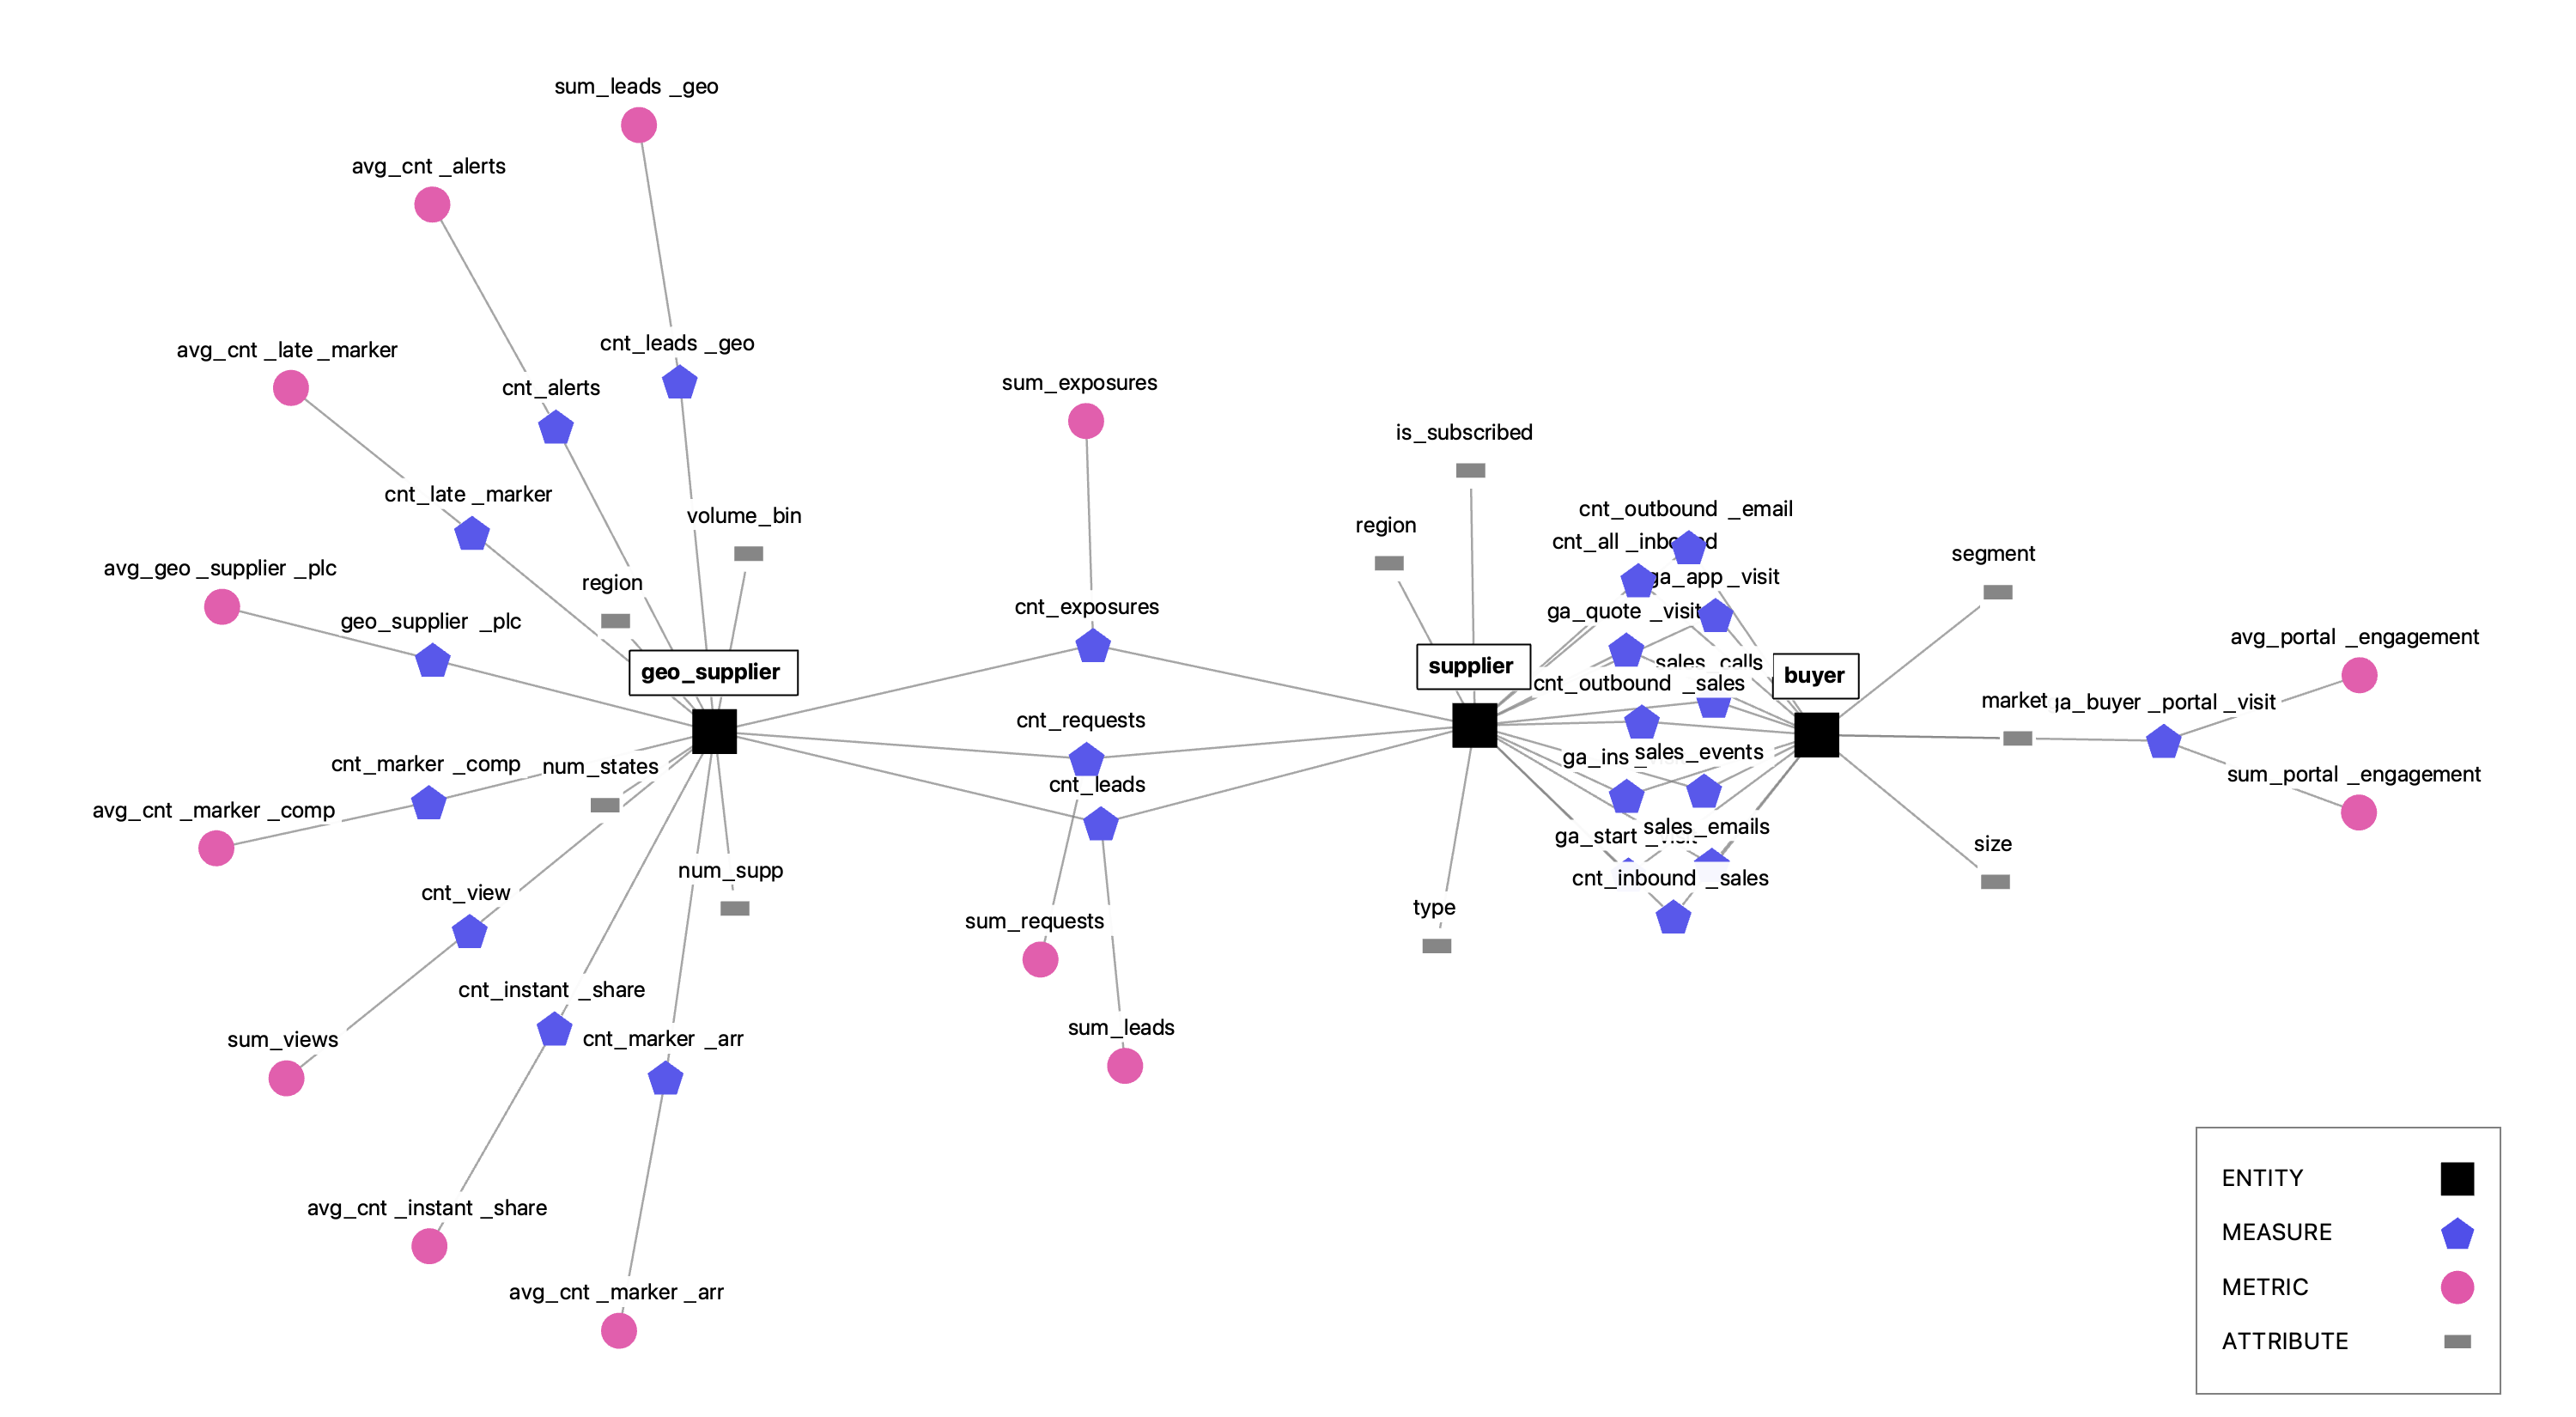
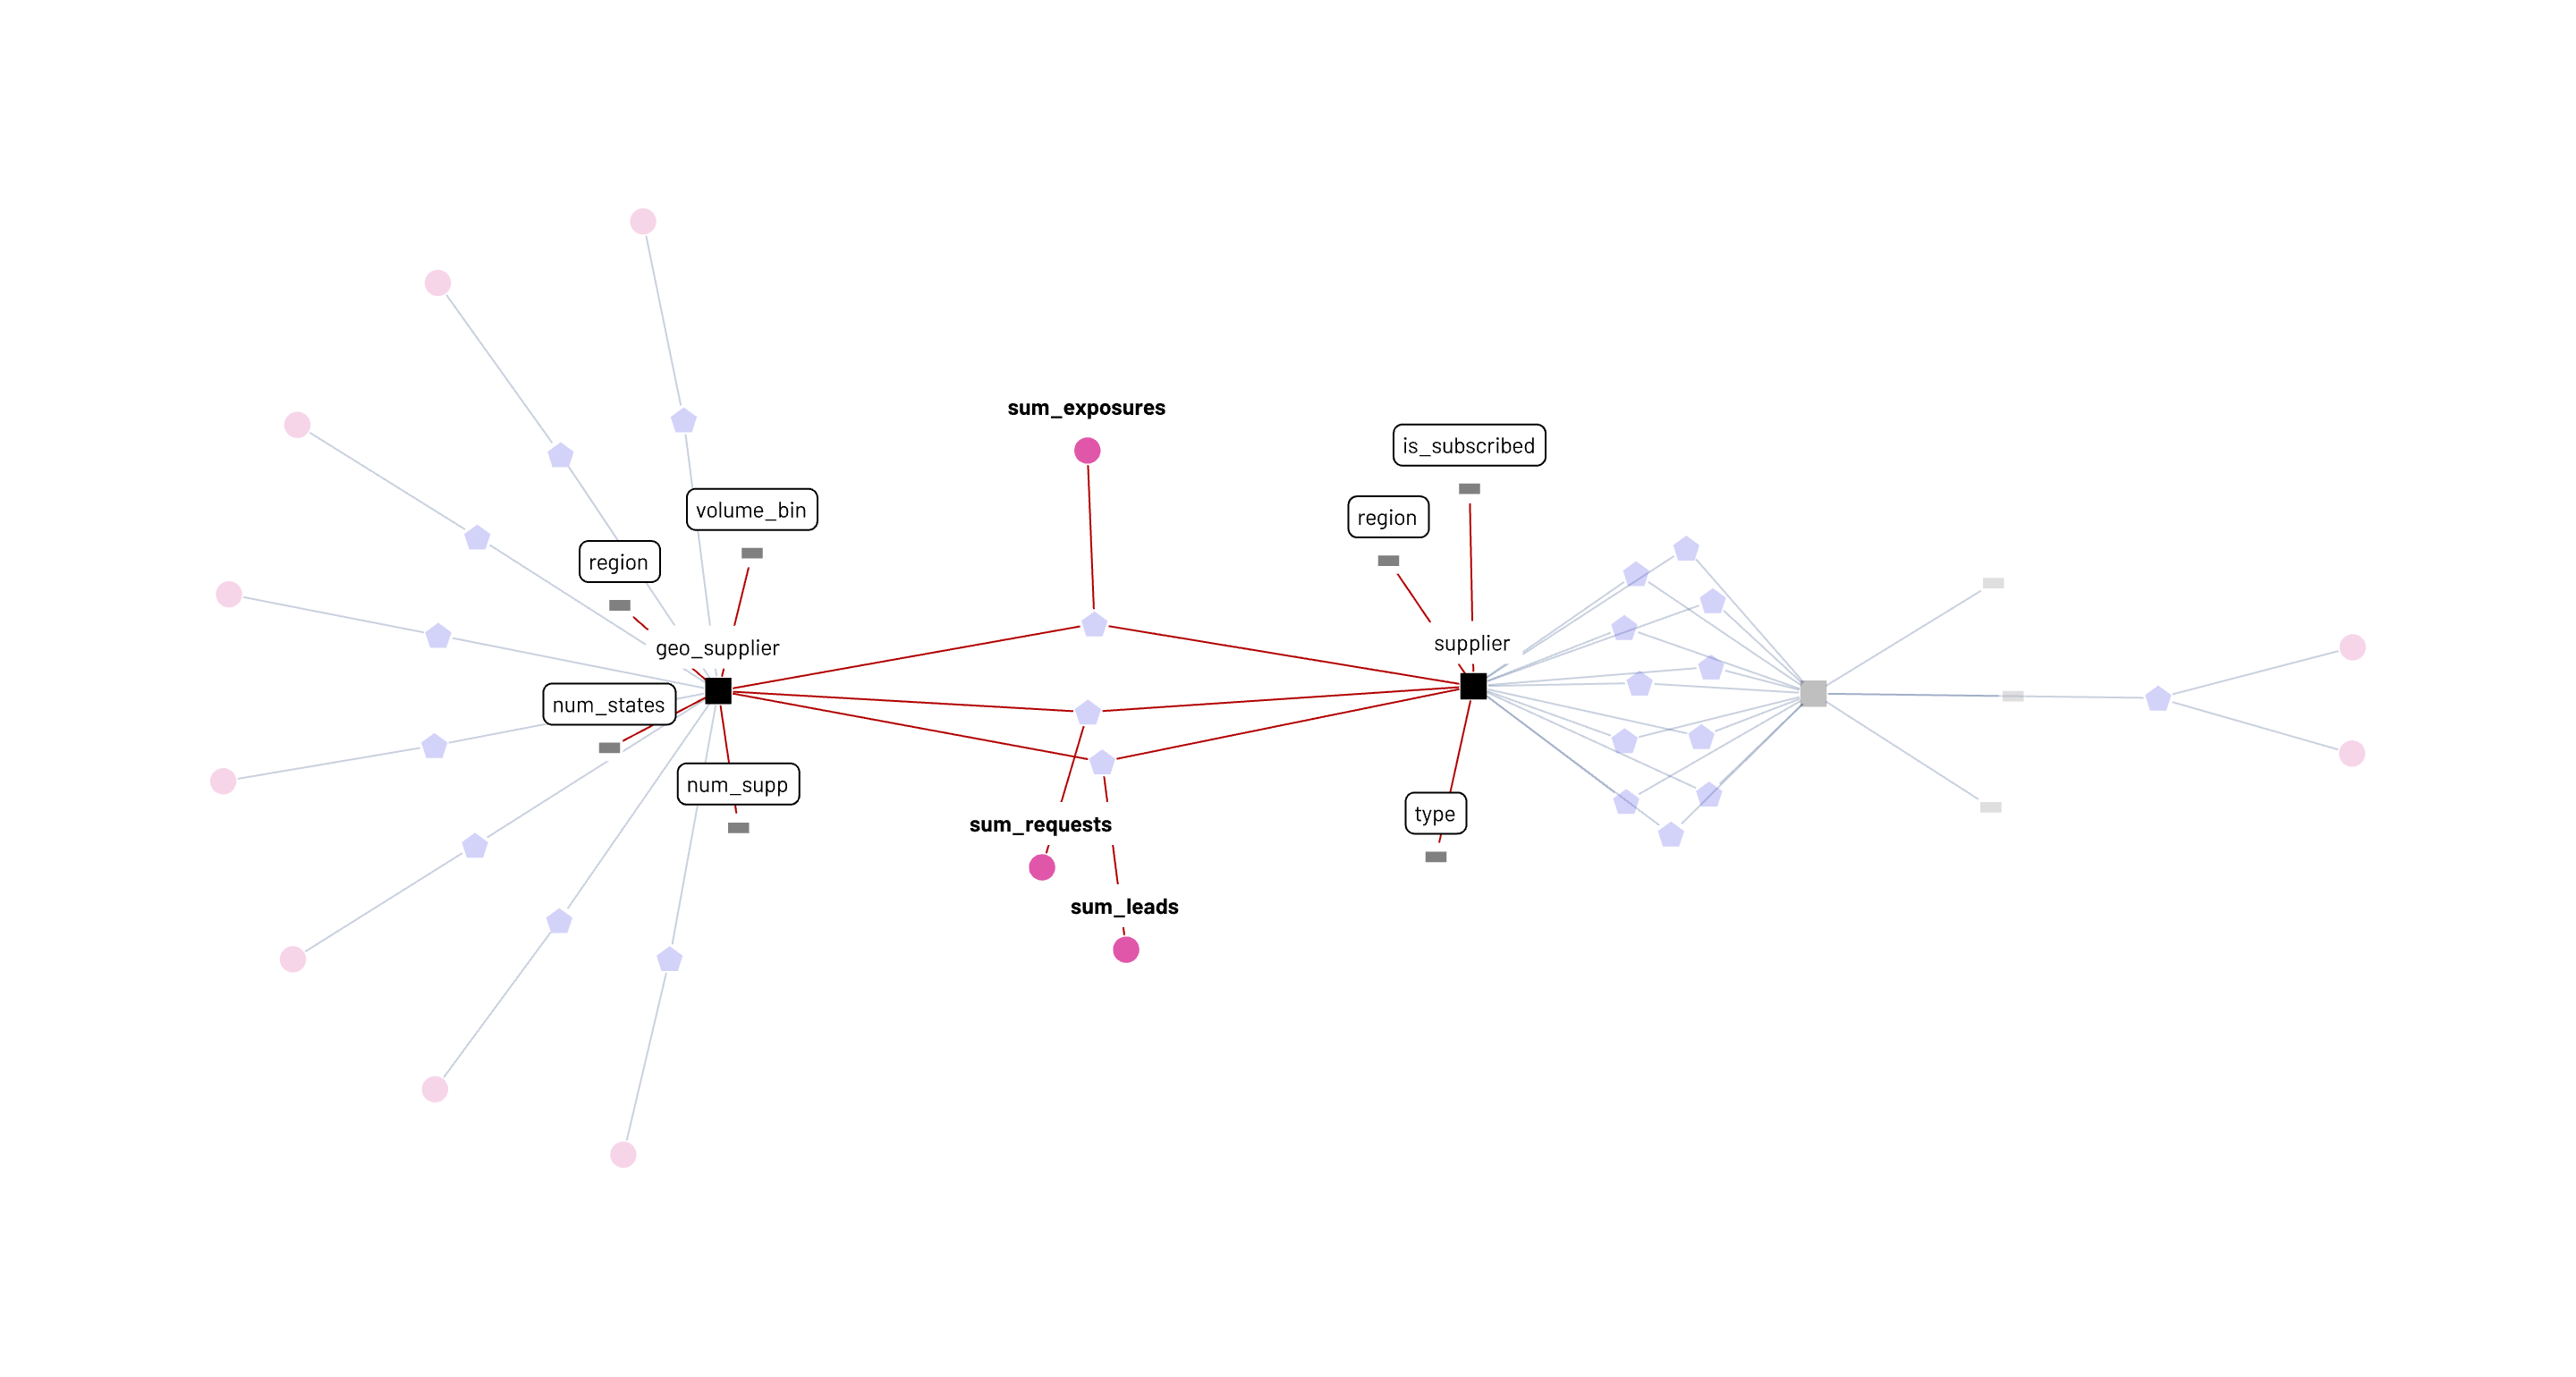
A simple but powerful interpretation of this graph is that it represents what’s computationally feasible in the business today. The business semantic graph is also a business computational graph. In the sub-graphs below, a data consumer can see that the sum_requests metric is available to be sliced and diced by seven attributes, attributes that come from both the supplier and geo_supplier entities.
Analysts embedded within decentralized geo_supplier and supplier teams can add a new attribute each to the system, and post-validation, sum_requests will have nine attributes available, while a fifth attribute is now available for the avg_cnt_alerts metric. So, we get an optimal workflow of centralized metric definitions (commonly agreed upon calculations) coupled with decentralized management of attributes to slice, dice and analyze the metric across teams. In all the recent buzz around metrics layers, metrics stores, metrics catalogs, and so on, the attribute has not been given its due. It is critical that we recognize the attribute’s role as a core concept that animates analytics work on metrics.
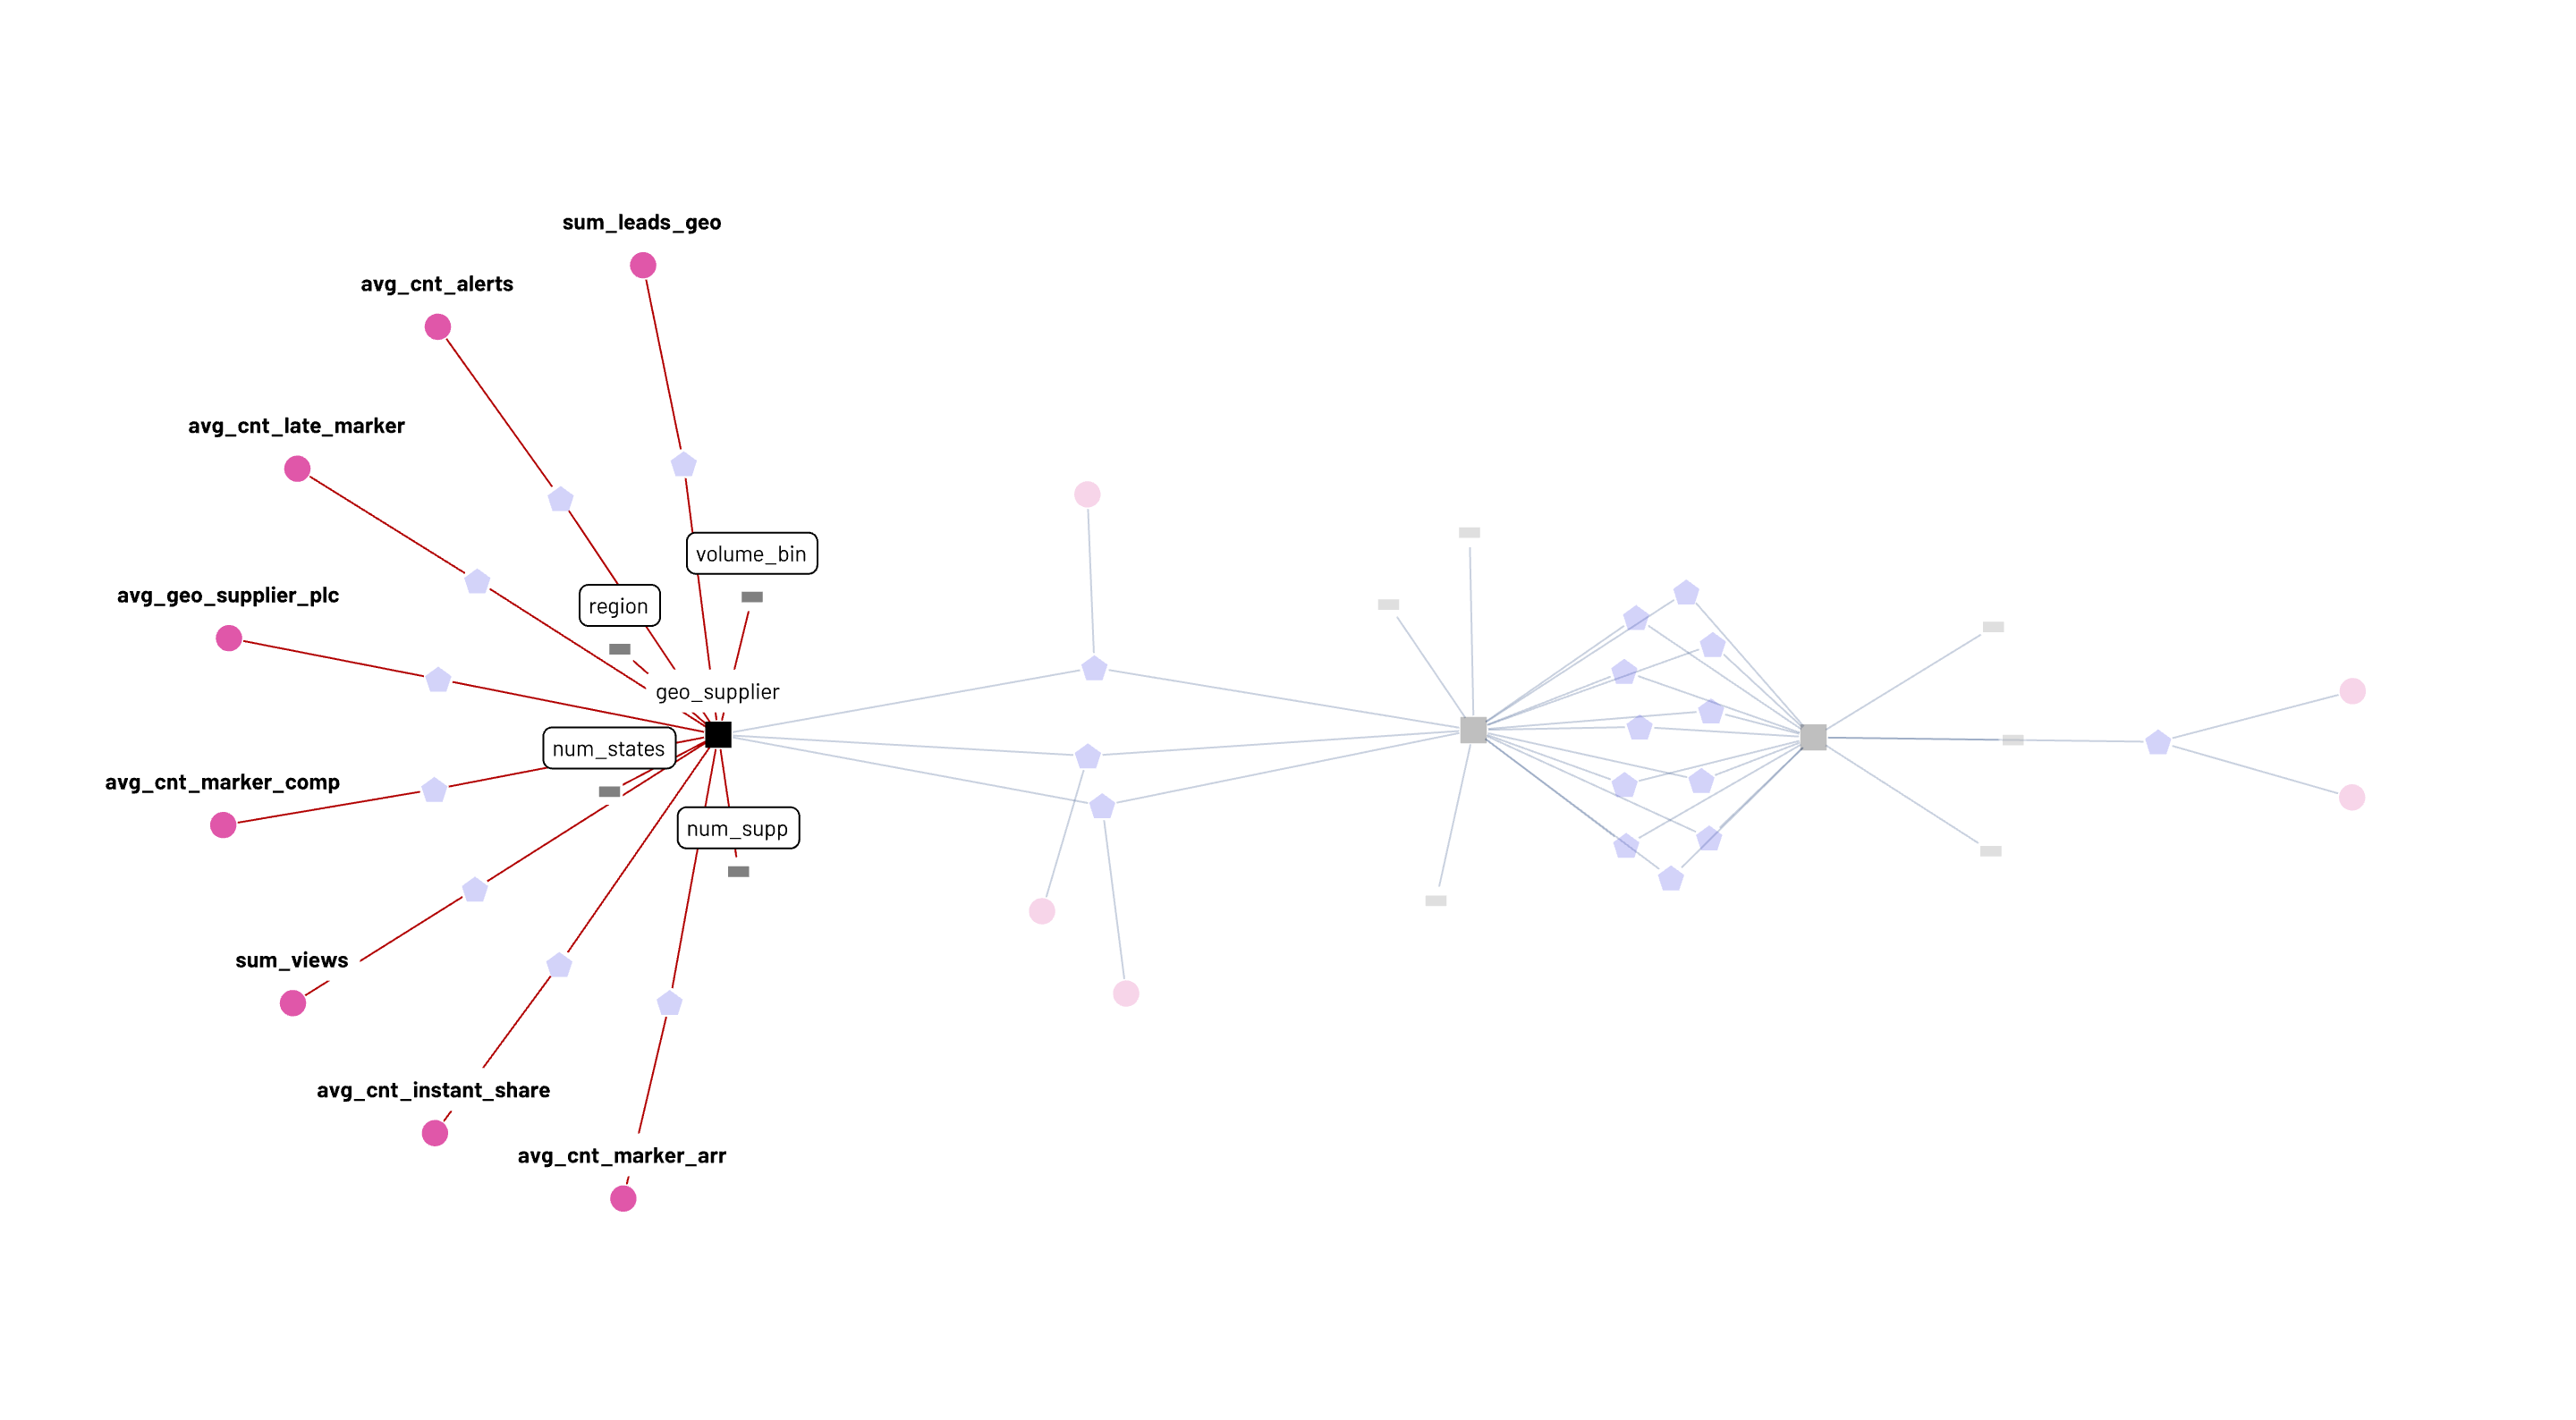
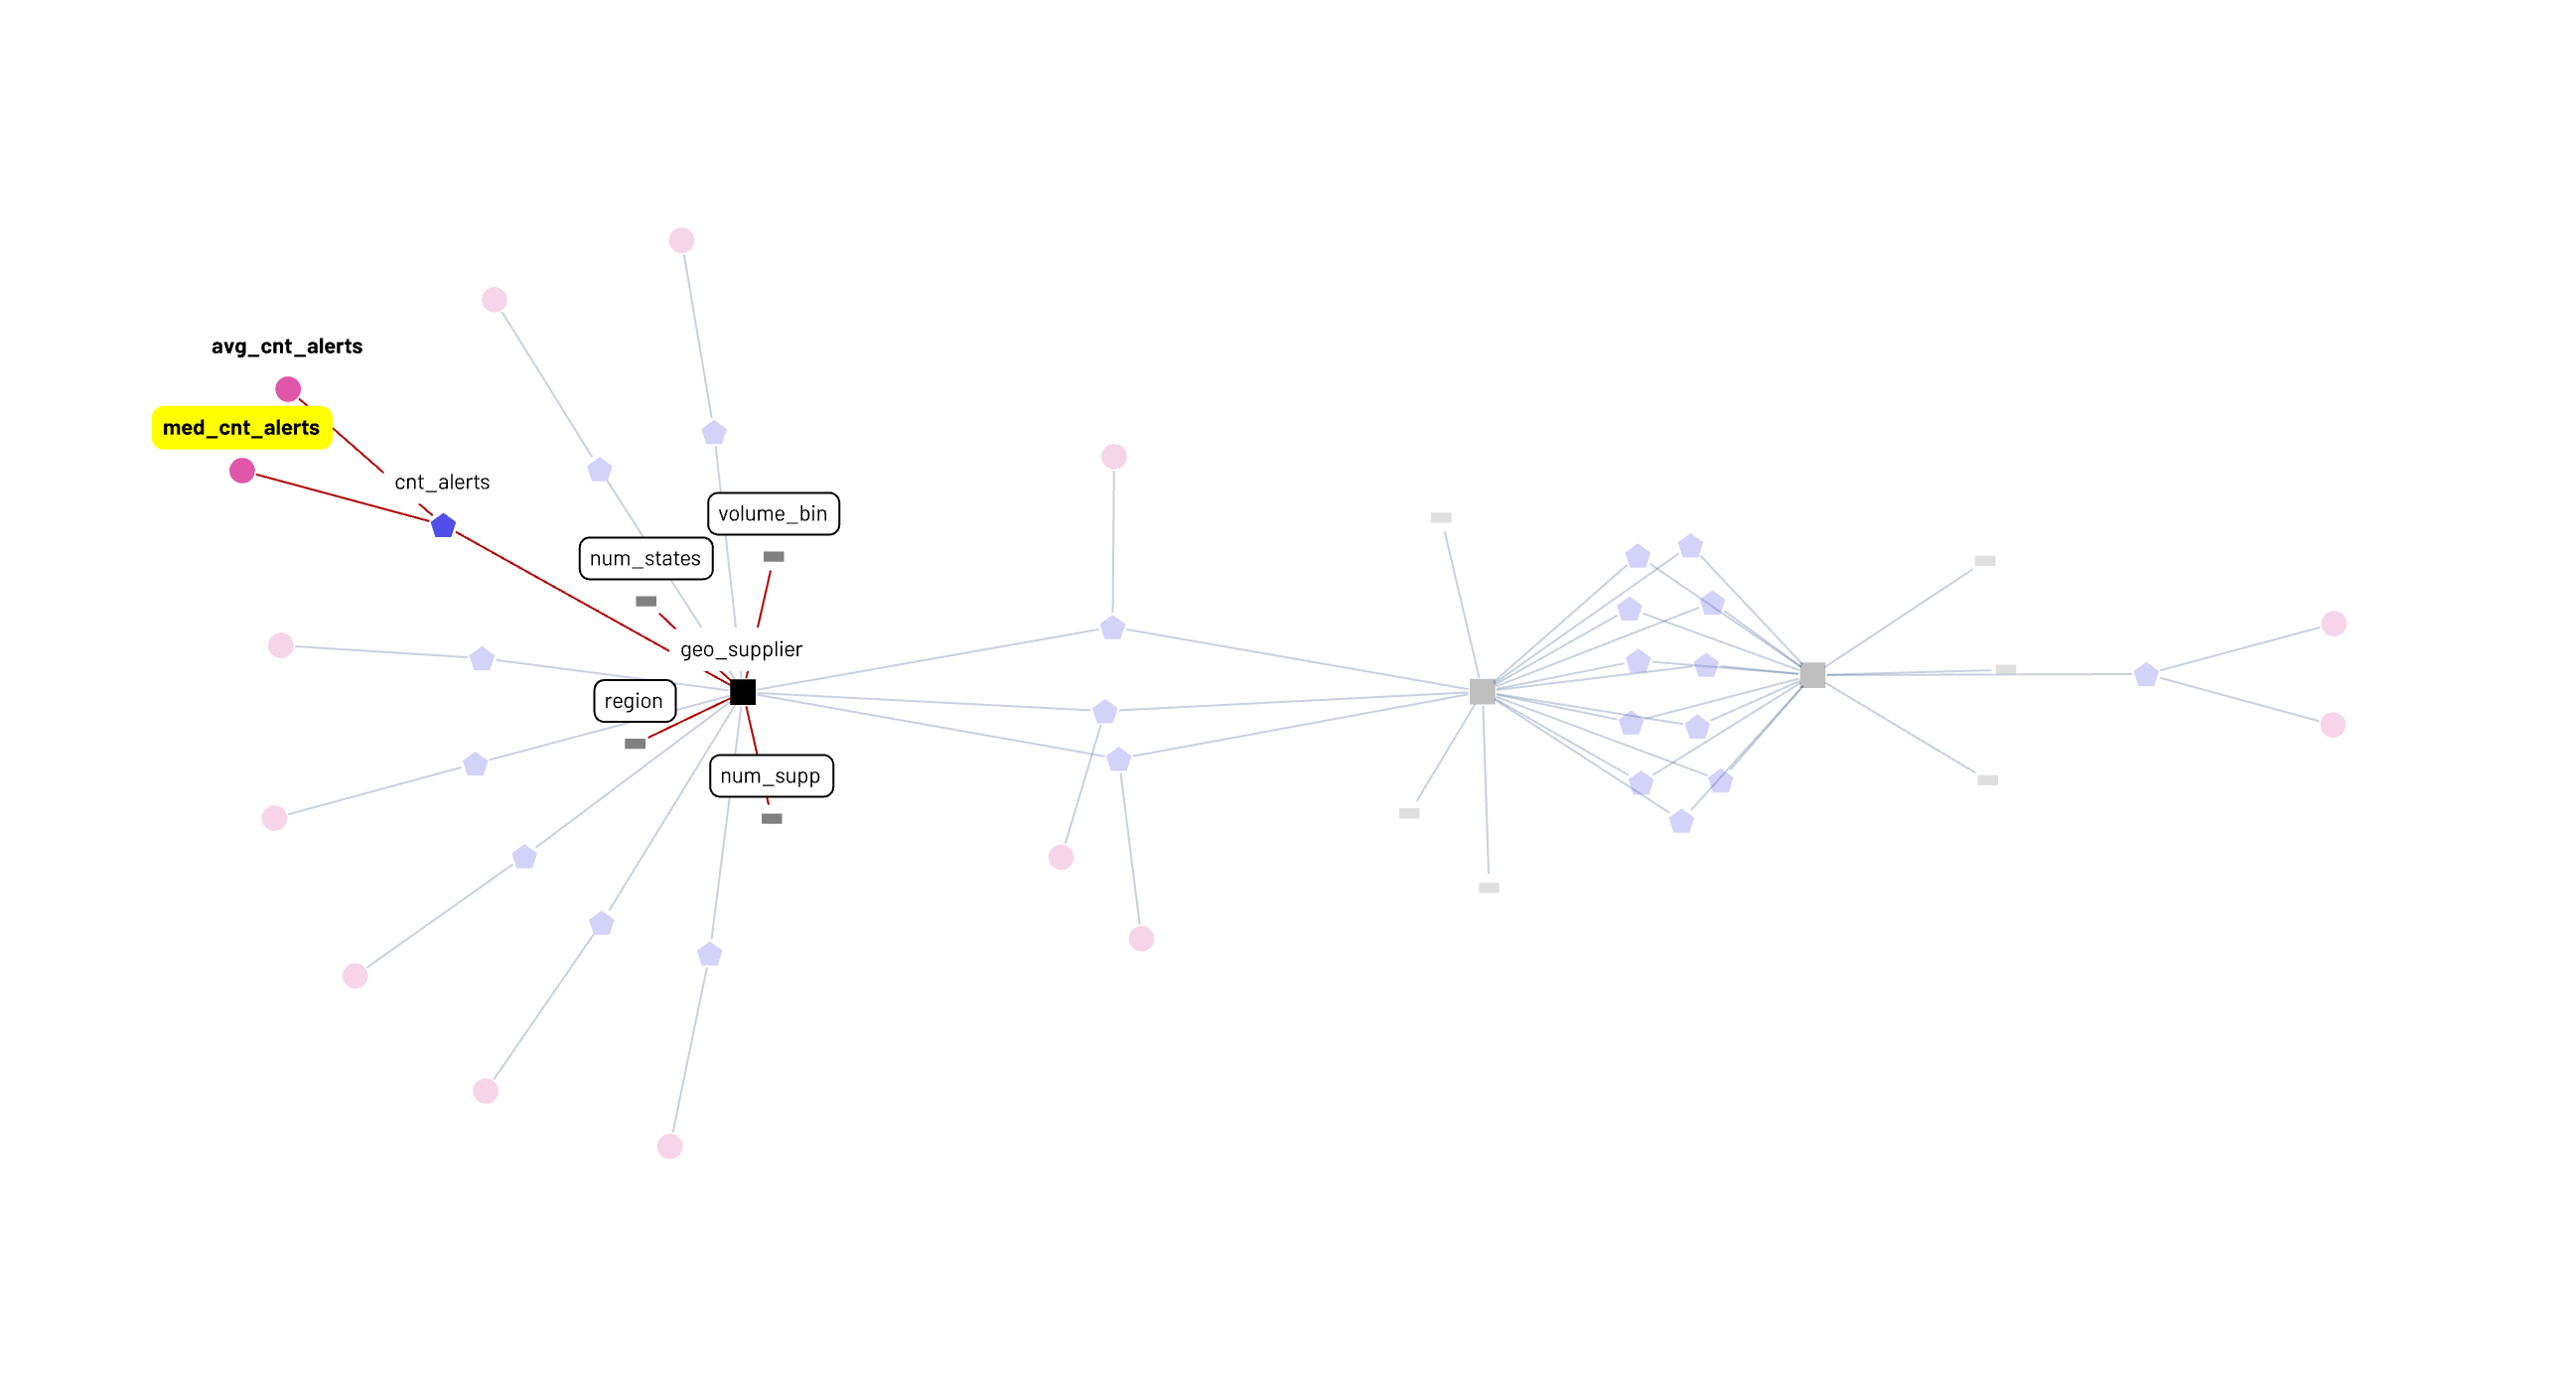
In terms of being able to act on the graph directly, data-adjacent folks in product or growth or finance have an interface where, without sweating the nuanced underlying logic of each measure or metric, they can create new nodes from existing validated nodes. A super-simple example shown in the graph below is adding a median_cnt_alerts metric by modifying avg_cnt_alerts with just a few clicks - no deep schema or sql knowledge necessary - and this new metric is now instantly available to be sliced and diced by the four already defined attributes.
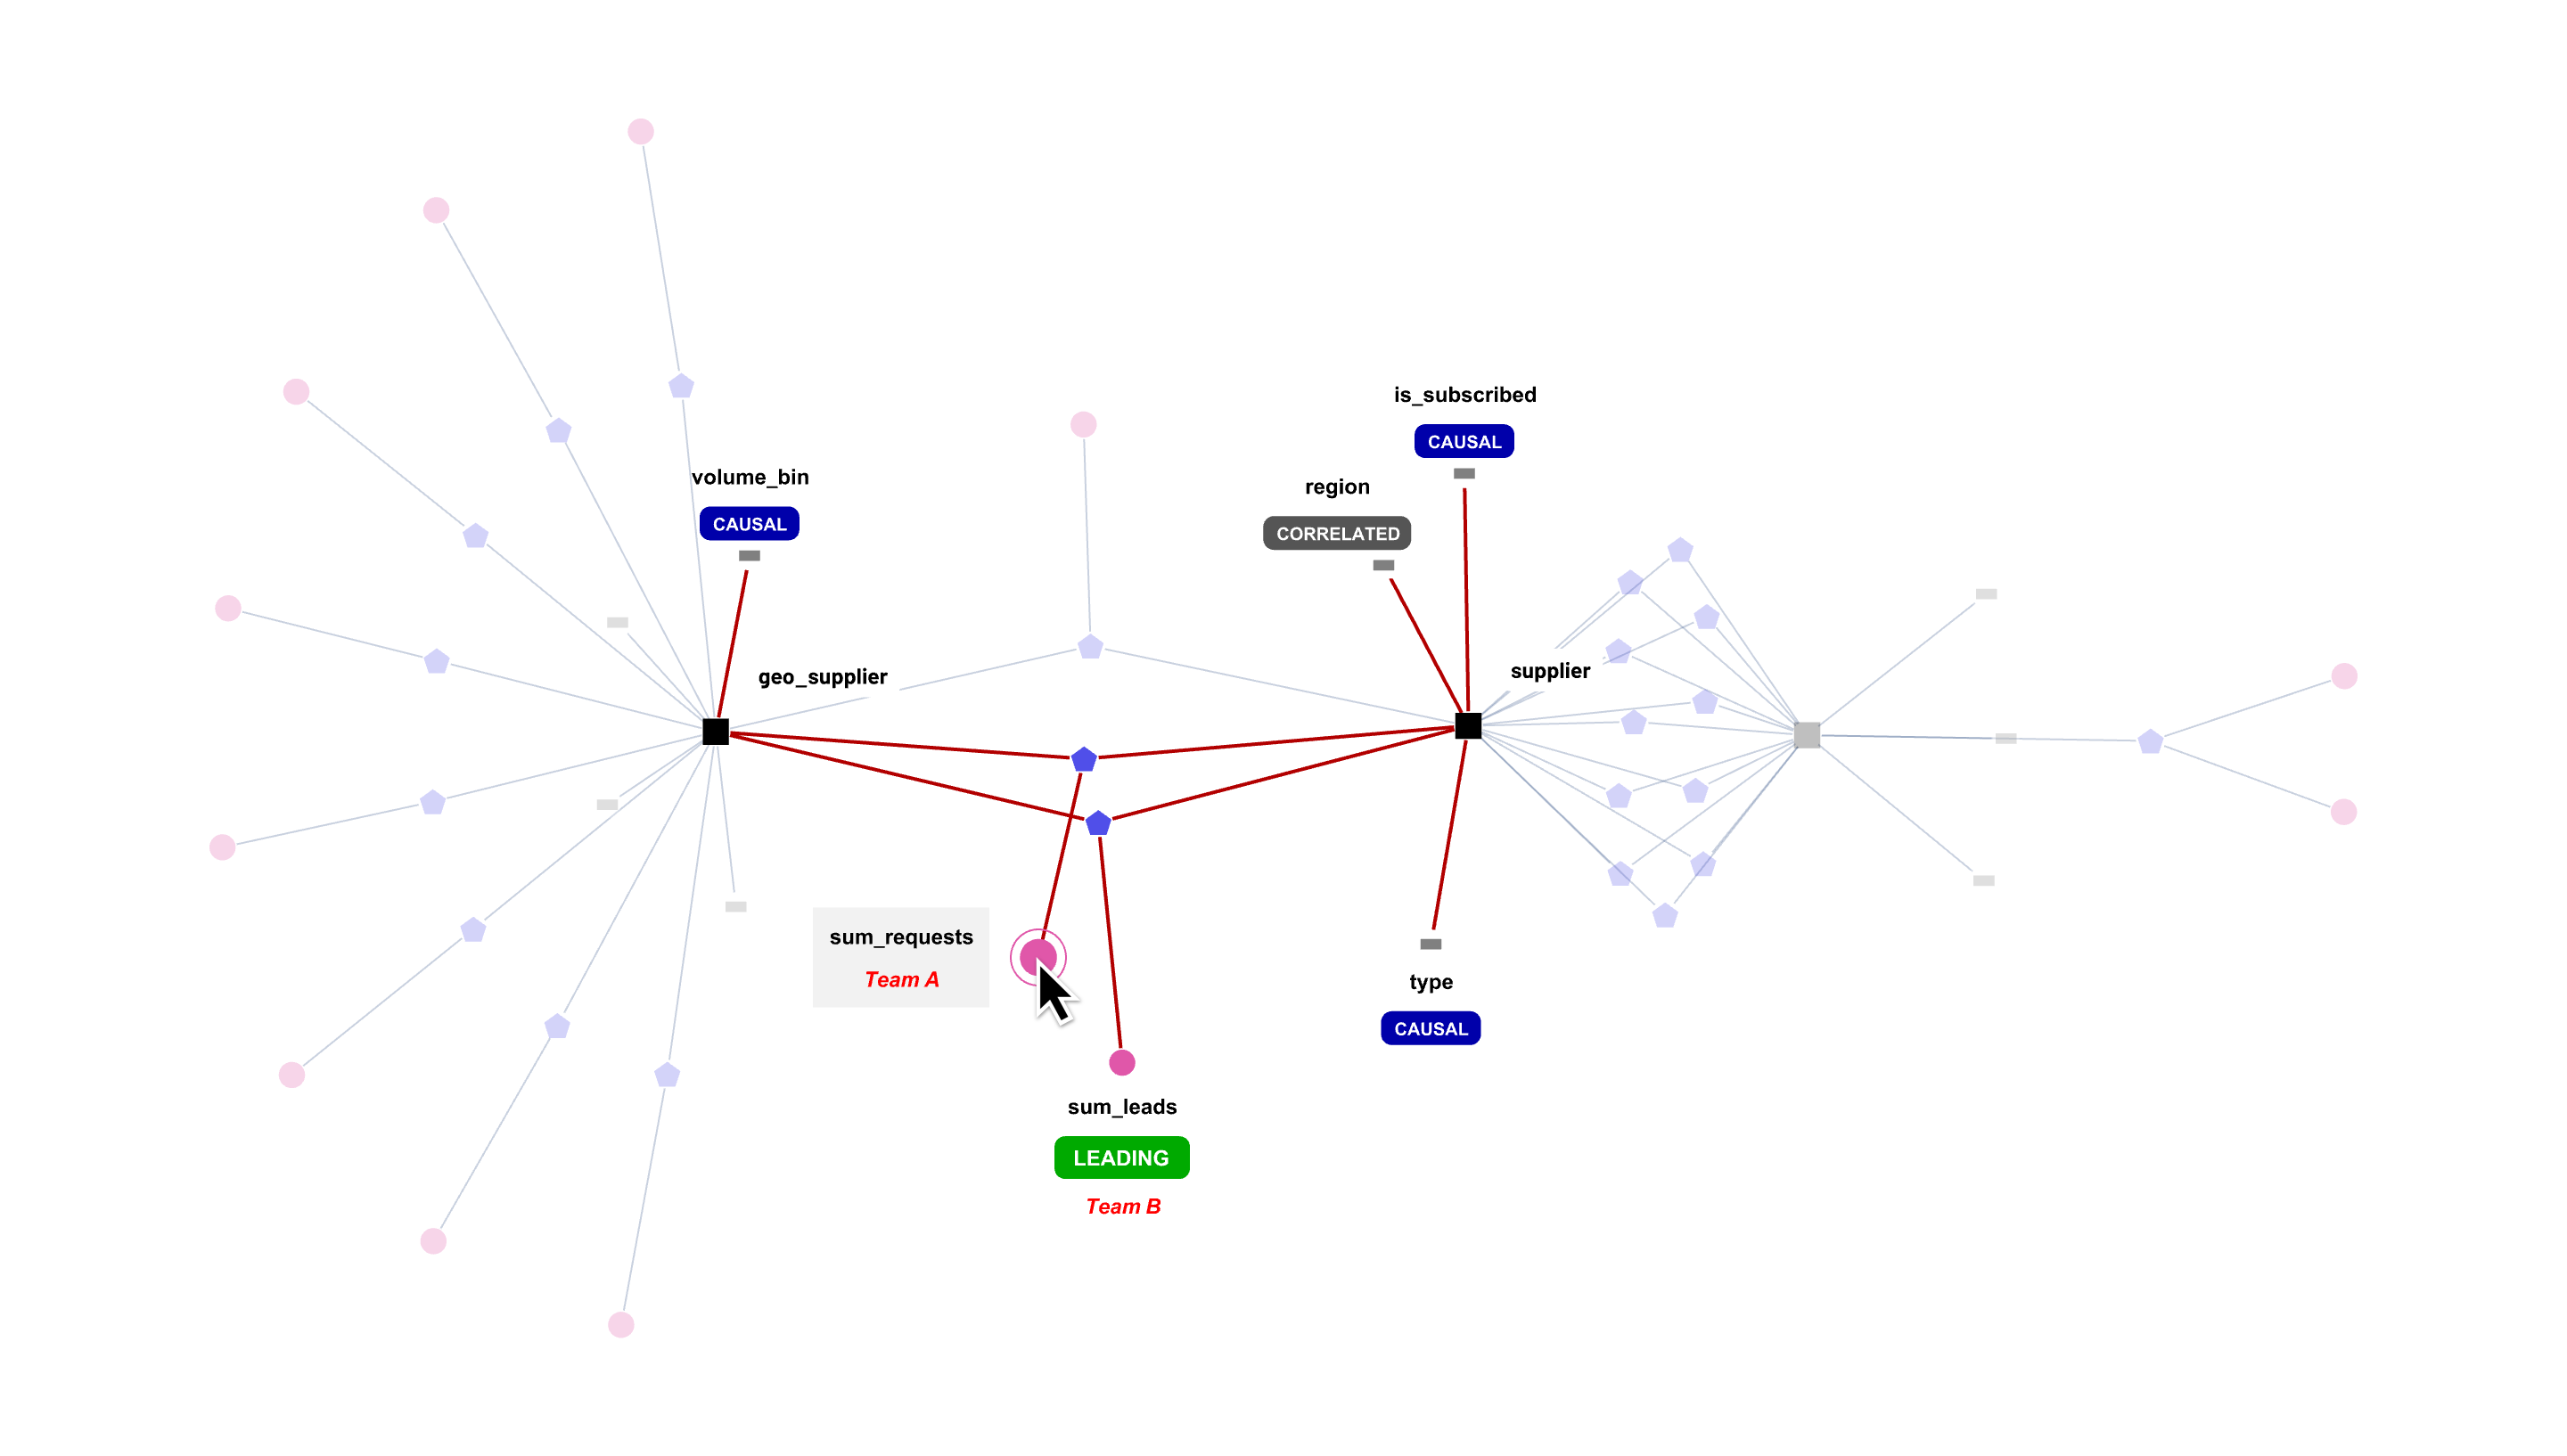
One of the future avenues for enhancing this graph is for multiple players in the organization to interactively align their hypotheses about the business. Take an example where a viewer can click into sum_requests metric, and see that sum_leads is a leading, correlated metric - that is, if leads increase, requests are likely to increase later. The viewer can also see that different teams own these metrics, and given different ownership of these metrics, this publicly acknowledges that sum_requests is dependent on both teams A and B.
The viewer can then observe that three specific attributes is_subscribed, type and volume_bin have been tagged as “causal” - which suggests that these attributes tend to drive this metric the most. region is tagged as “correlated” suggesting that there is a relationship but not likely to be causal. Now, the viewer can select this metric, pick the three causal attributes, and call an application to analyze in more granular detail, how specific segments with different values of type, volume_bin and is_subscribed impact the metric in question. Or, maybe it’s already computed for a recent window, and stored for quick retrieval and display associated with the graph.
The connected business semantic graph holds immense potential, both as a catalog-like informational resource, a tool that can foster transparency and collaboration, and as a powerful operational tool. There is so much more to fathom and build in the next wave of the data revolution.


