
This is a post about data and narratives, taking the US mid-term elections as a case study. It is a reminder of the complex interaction between data, its interpretation and the construction of narratives - prevalent in any organization that strives to utilize data in decision-making.
The surprise over-performance of the Democrats (Ds) is a direct result of the dominant narrative leading into the election - that Republicans (Rs) would win in a landslide, a “red wave” if you will.
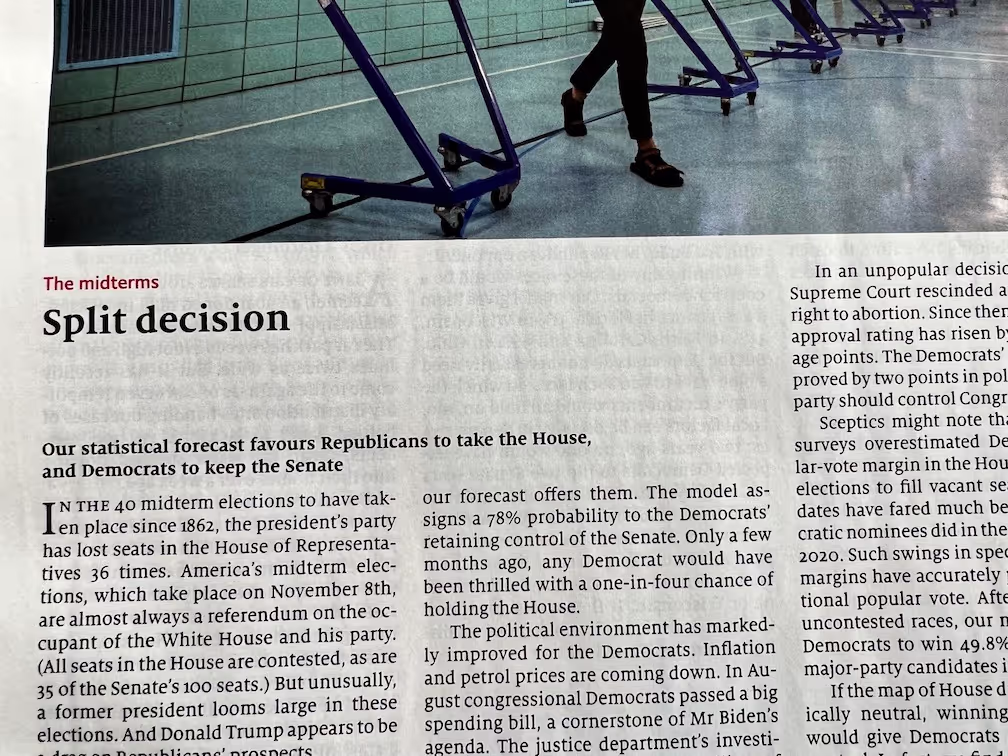
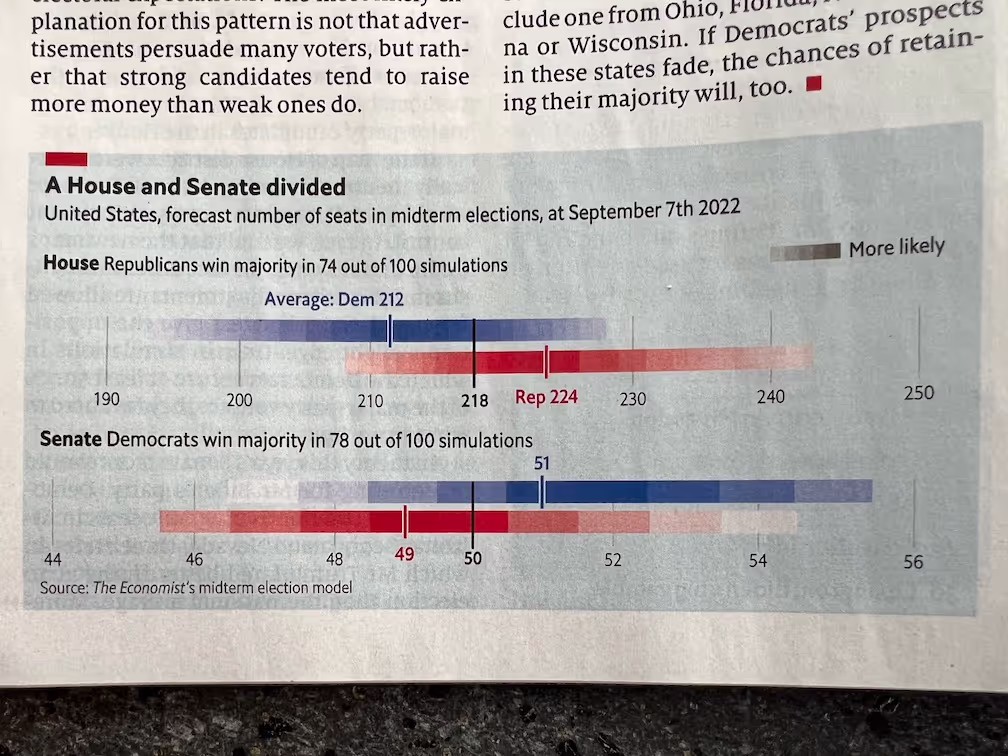
But, here’s the strange part. The Economist’s forecast in the Sep 10th issue (image below) predicted the Rs win the House (not in a blow-out), and the Senate stays with the Ds (with 78% probability). Non-partisan polls always showed a tight political environment throughout.
So, how did the dominant narrative of a R “red wave” emerge? How did the data lead to that narrative?
The first part - polling, and in general, data has uncertainty bands. So, if you pulled the data a few points towards the Rs, you can easily see a “red wave” - BUT if you did the same towards the Ds, they would have retained the house, and gained a few seats in the Senate. Haven’t we all worked with folks who built narratives by nudging the numbers in a certain direction?
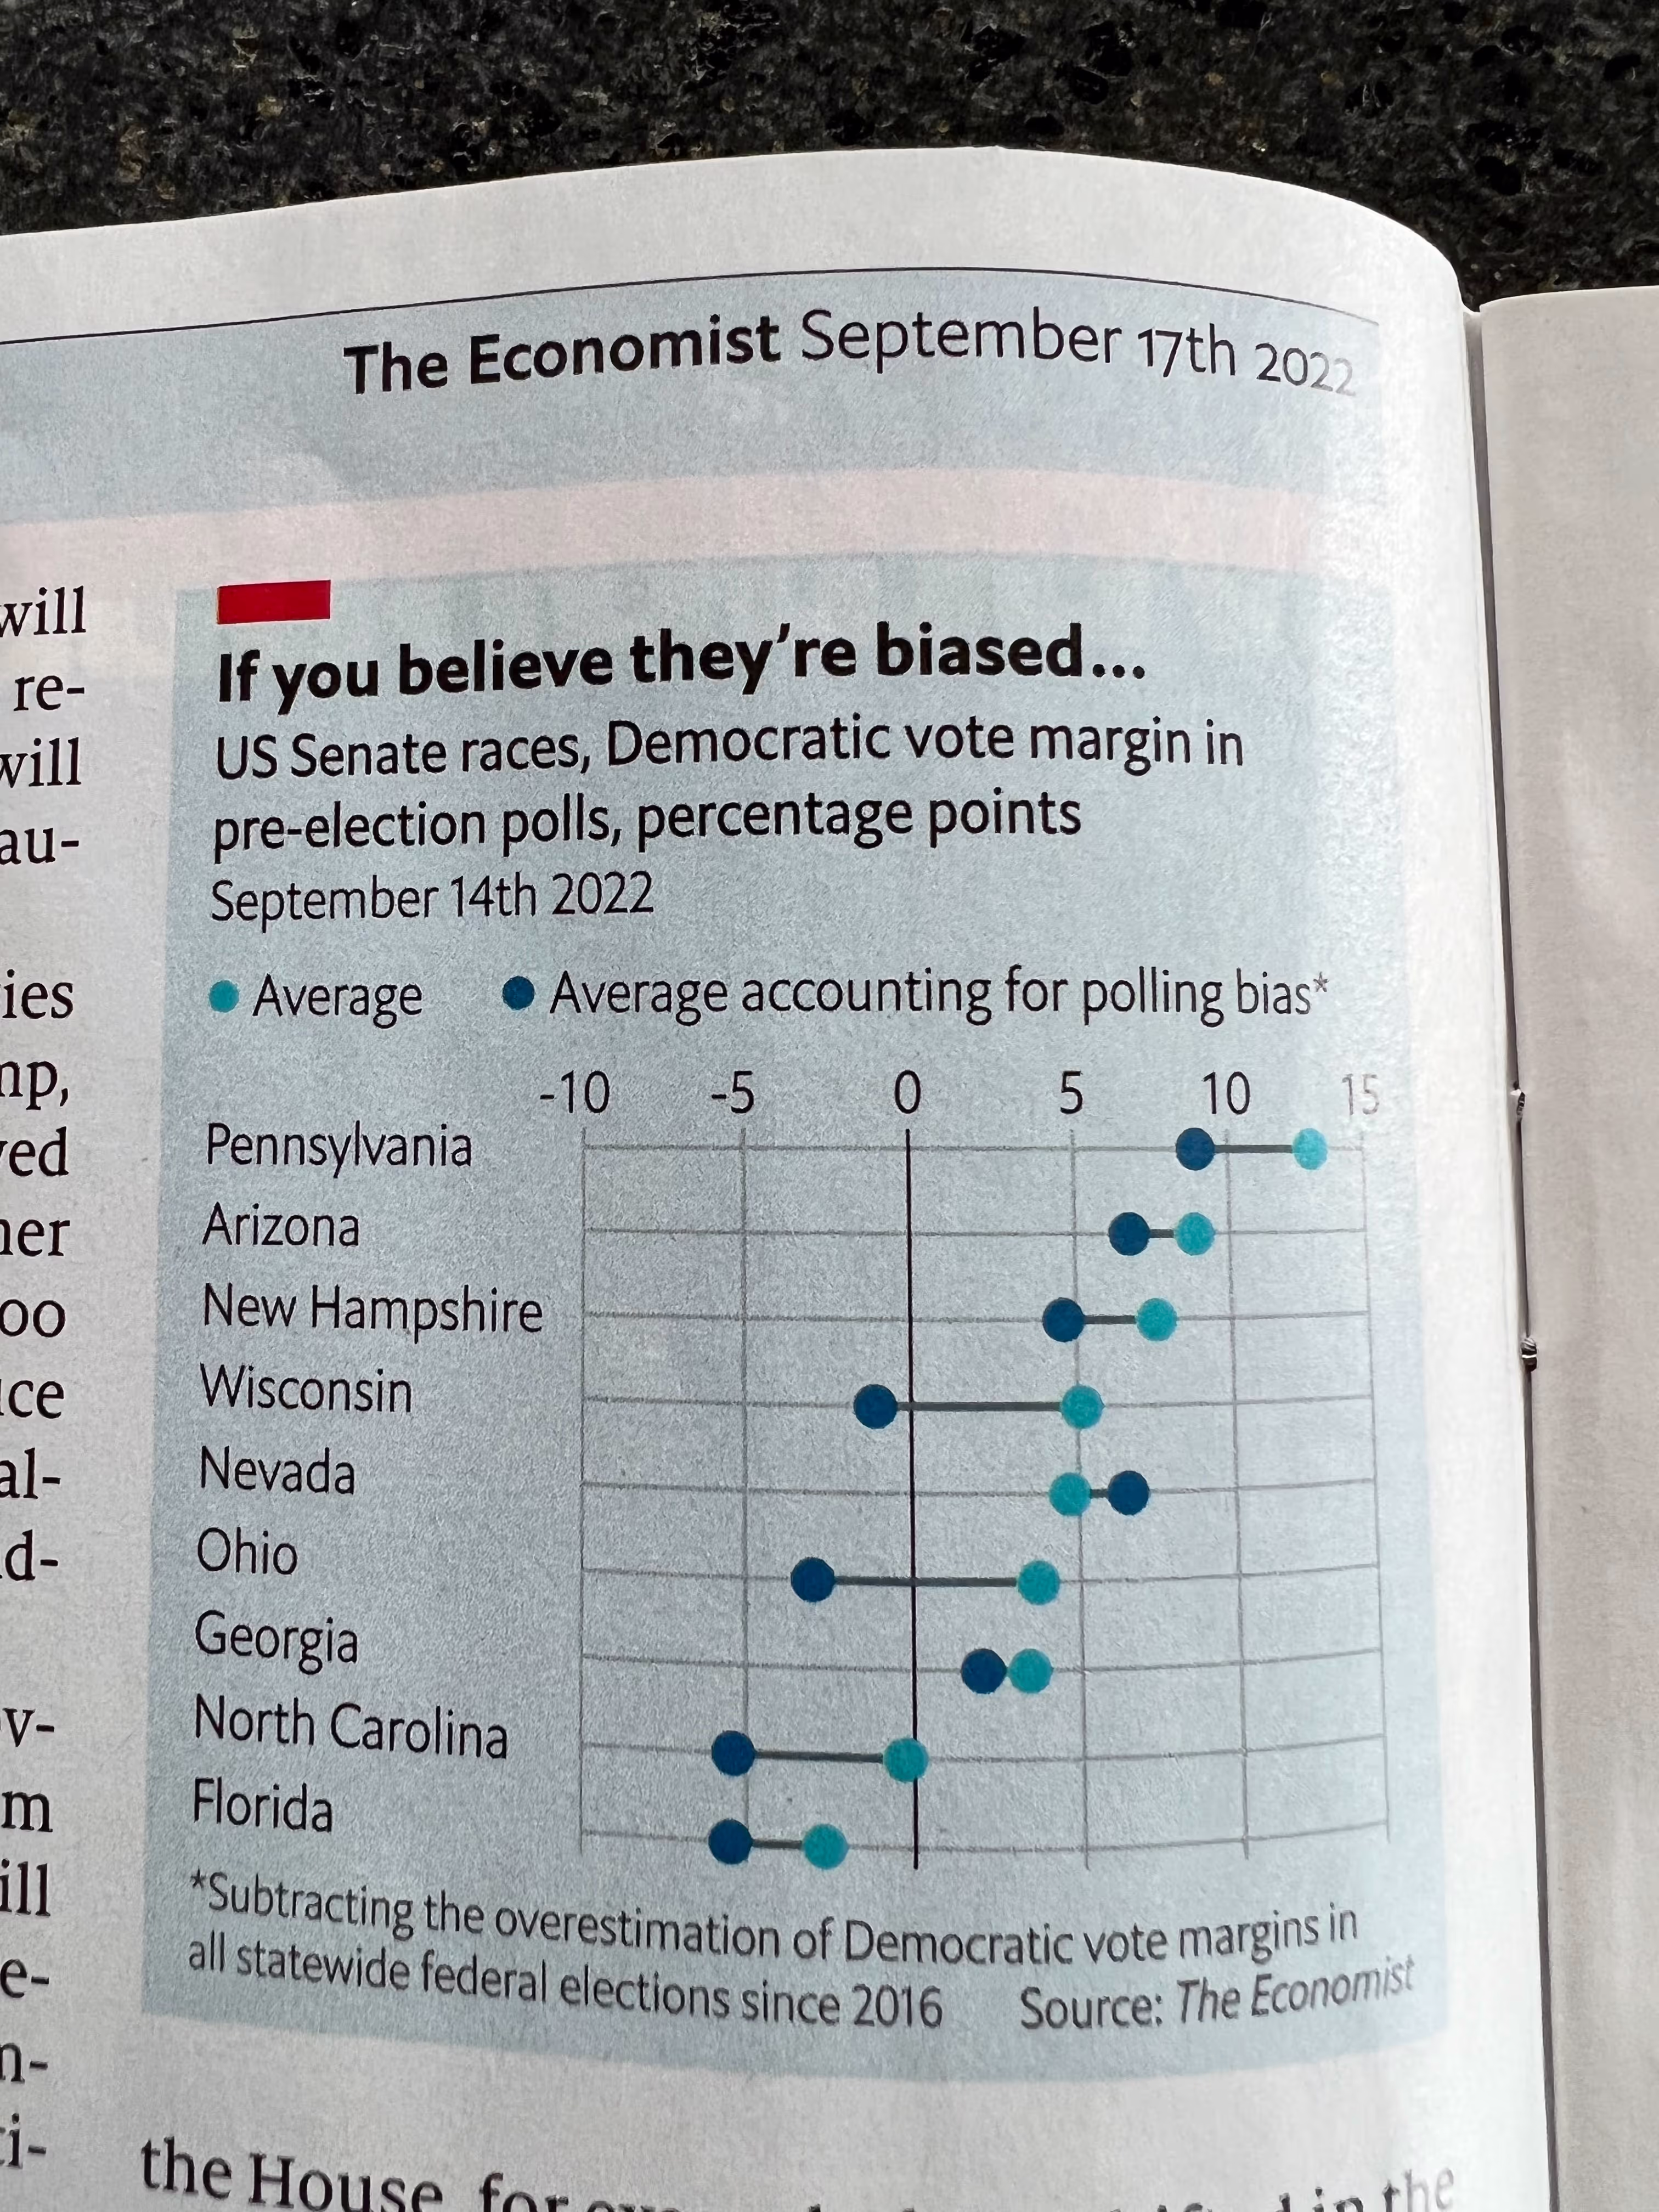
The second part has legs. Polling has recently under-estimated R voters. So, a few points of adjustment could yield the red wave. But, the beauty of numbers is this can be “controlled” for, something analysts do all the time in organizations. The Economist, in fact, published an adjusted chart for the key Senate races (image below), which eerily matches exactly what happened.
The third part - and this is the trickiest one as it involves a combination of the “precedence” argument + a thick coating of human instinct.
Most presidents lose Congressional seats in in the mid-terms. And combined with a low approval rating, this pointed to a red wave. But, you are dealing with small sample sizes for a system of such changing dynamics and complexity. How many mid-terms can you truly compare the current one to?
Even if you use all the off-cycle mid-terms going back to 1930, you only have 23 data points - and there are 4 times the president’s party gained seats, and another 4 times the party wasn’t blown out. That’s decent odds!
And then finally, “instinct” always kicks in to build the narrative from the data - instinct is a mix of precedence + recency bias + emotion. Obama lost 60+ house seats; Trump lost 40+ seats - and, with the majority of voters unhappy, this must be a blow out election for the Rs.
I’m not arguing precedence and instinct have no role to play - rather, we acknowledge that the process of drawing conclusions and making decisions often involves
- taking the datasets as-is
- adjusting them - hopefully for the right reasons, like controlling for data gathering bias
- layering in what we know about the past, and our current instinct to build the narrative
In short, as organizations push and pull the data to build narratives, it’s critical that they are self-aware about the process and its pitfalls.
If you’ve heard the phrases - “follow the data” or “the data will tell us” - it doesn’t quite reflect reality. We (as humans) adjust, interpret and build a narrative. Or, is it the other way round? 🙂


